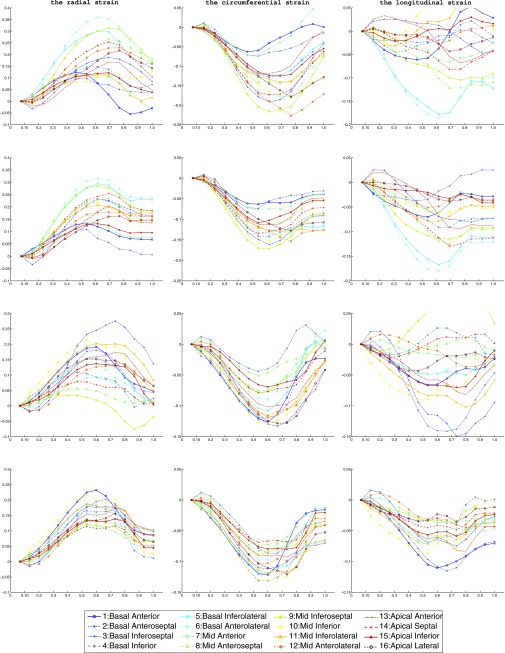
Figure 14.
The radial, circumferential, and longitudinal strains of the 16 AHA segments in the TDFFD method (first and third rows) and our method (second and fourth rows) estimated from two baseline sequences. The horizontal axis is the normalized cardiac time, the vertical axis is the strain. The markers used for the 16 AHA segments are shown in the bottom of the figure.

