
Figure 3.
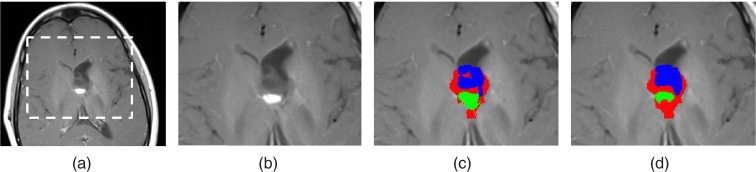
(a) A representative slice of T1c image from a follow-up scan. (b) An enlarged view of the tumor area. (c) Algorithm results and (d) manually delineated ground truth of OPG classified into solid, enhancing and cyst components.
Official websites use .gov
A
.gov website belongs to an official
government organization in the United States.
Secure .gov websites use HTTPS
A lock (
) or https:// means you've safely
connected to the .gov website. Share sensitive
information only on official, secure websites.
(a) A representative slice of T1c image from a follow-up scan. (b) An enlarged view of the tumor area. (c) Algorithm results and (d) manually delineated ground truth of OPG classified into solid, enhancing and cyst components.