
Figure 4.
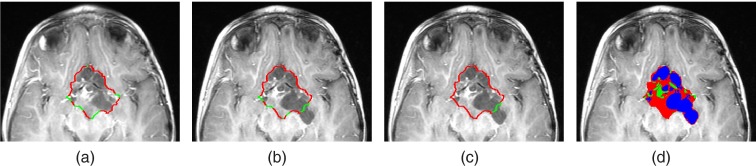
(a) and (b) Sharp and fuzzy boundary segments of the input baseline segmentation, overlaid on T1c image of baseline (a) and follow-up (b) scans. (c) shows the fixed and changing boundary segments of the baseline input segmentation overlaid on the follow-up scan. (d) presents the boundary of the tumor in the follow-up scan, after updating the boundary segments and delineating the voxels into solid enhancing and cyst tumor component.