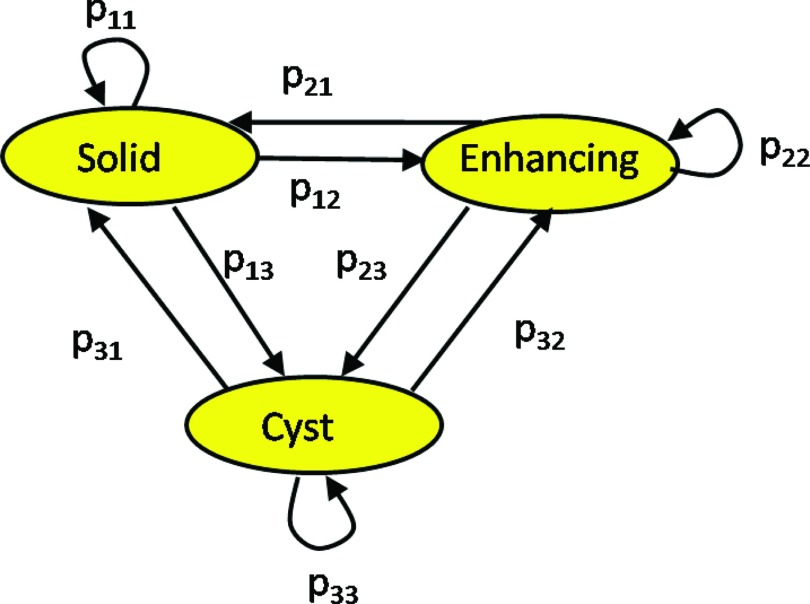
Figure 5.
A transition model for three tumor components in its graphical (left) and matrix (right) forms. It describes the probability of a tumor component to change its state between a baseline follow-up scans. The nodes represent the tumor components and the edges are the transition probabilities.

