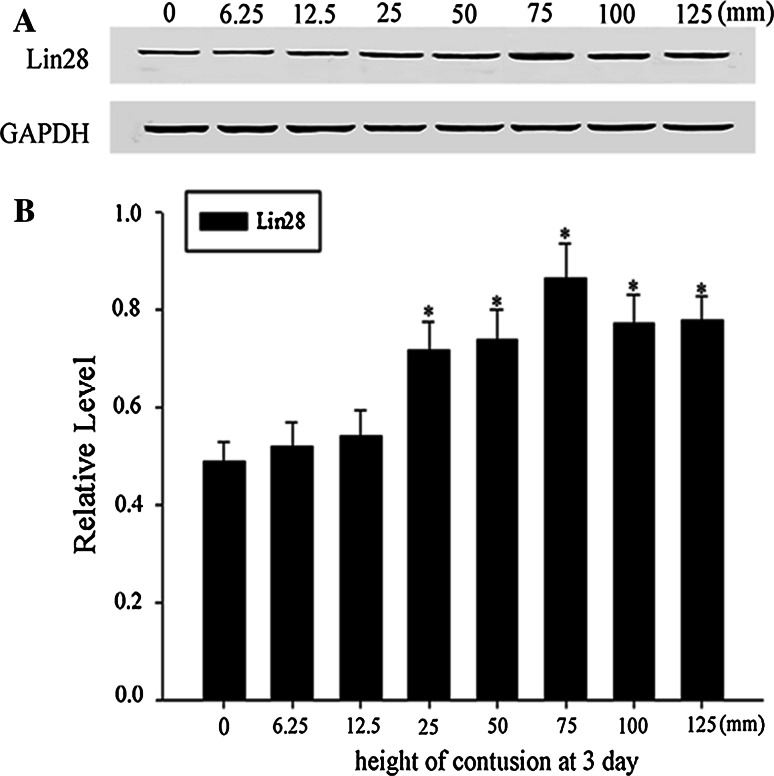
Fig. 3.
Dose-response effects’ between the SCI and LIN28 expression. Spinal cord tissues from rats at various degrees of contusion induced by different heights (0, 6.25, 12.5, 25, 50, 75, 100, and 125 mm) at day 1 after SCI were homogenized and subjected to immunoblot analysis. Sample immunoblots probed with LIN28 and GAPDH are shown above (a). The bar chart below demonstrates the ratio of LIN28 to GAPDH for each height point (b). Data are mean ± SEM (n = 3; *p < 0.05, significantly different from the sham group)

