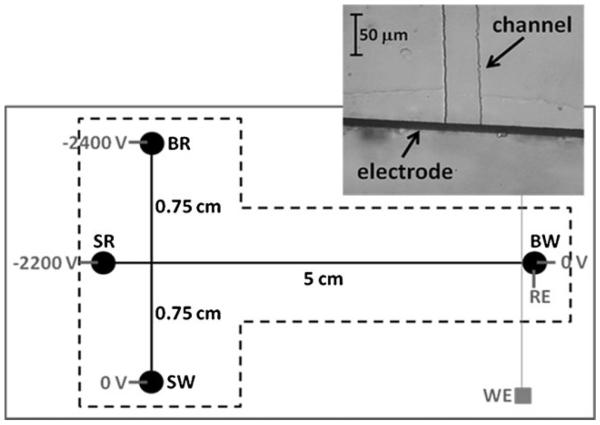
Fig. 1.
Microchip setup. BR, SR, BW, and SW indicate BGE, sample, BGE waste, and sample waste reservoirs, respectively. WE and RE are working (Pt band) and reference (Ag/AgCl) electrodes, respectively. The dotted line represents the limits of the PDMS microchip. The inset shows a microscopic image from the electrode/channel alignment

