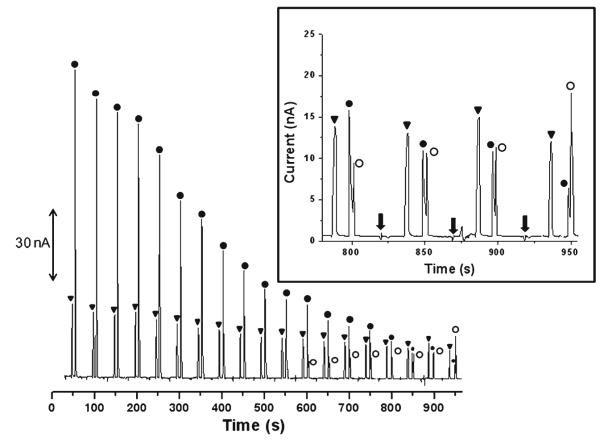
Fig. 3.
Monitoring the acid hydrolysis of DEA/NO at pH 7. Conditions: BGE 10 mM boric acid, 2 mM TTAB, pH 11. Triangle nitrite; solid circle DEA/NO; open circle NO. Gated injection −2,200 V at SR, −2,400 V at BR, 1 s injection, 60 s run. The inset shows the magnification of the electropherogram from 750 to 950 s. The arrows indicate the sample injection

