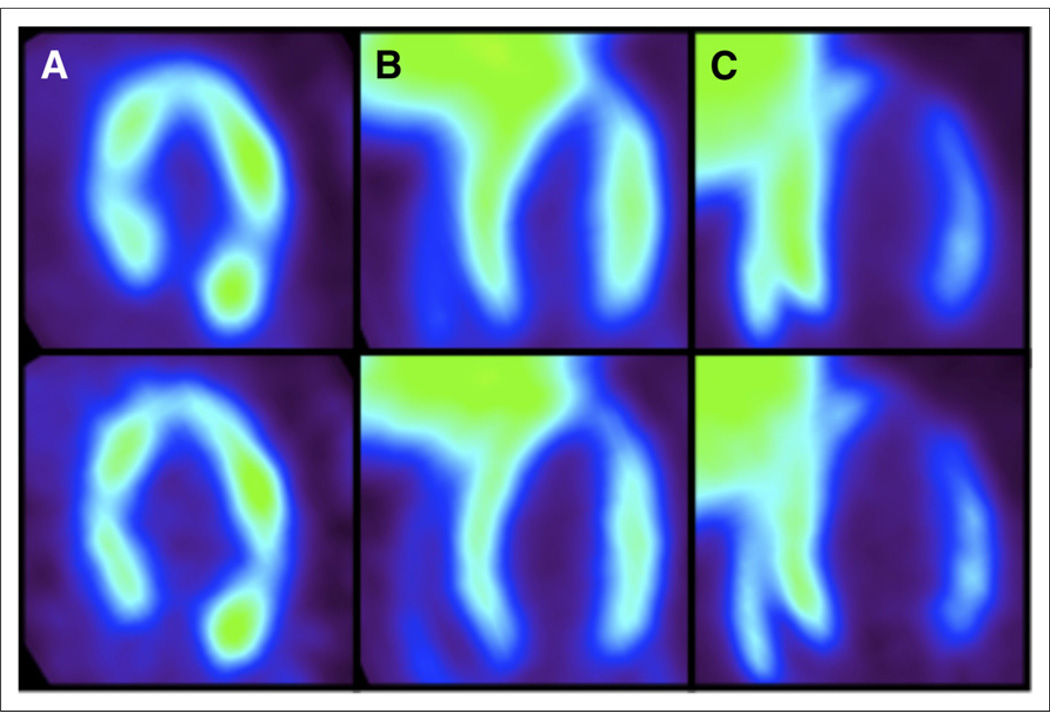
FIGURE 1.
(Top) PET images corresponding to all electrocardiogram bins summed. (Bottom) PET images corresponding to only diastolic electrocardiogram bins summed. (A) 18F-FDG images of SHR show almost no liver uptake. (B) 18F-FDHROL images of SHR show substantial liver uptake. (C) 18F-FTHA images of SHR again show substantial liver uptake.

