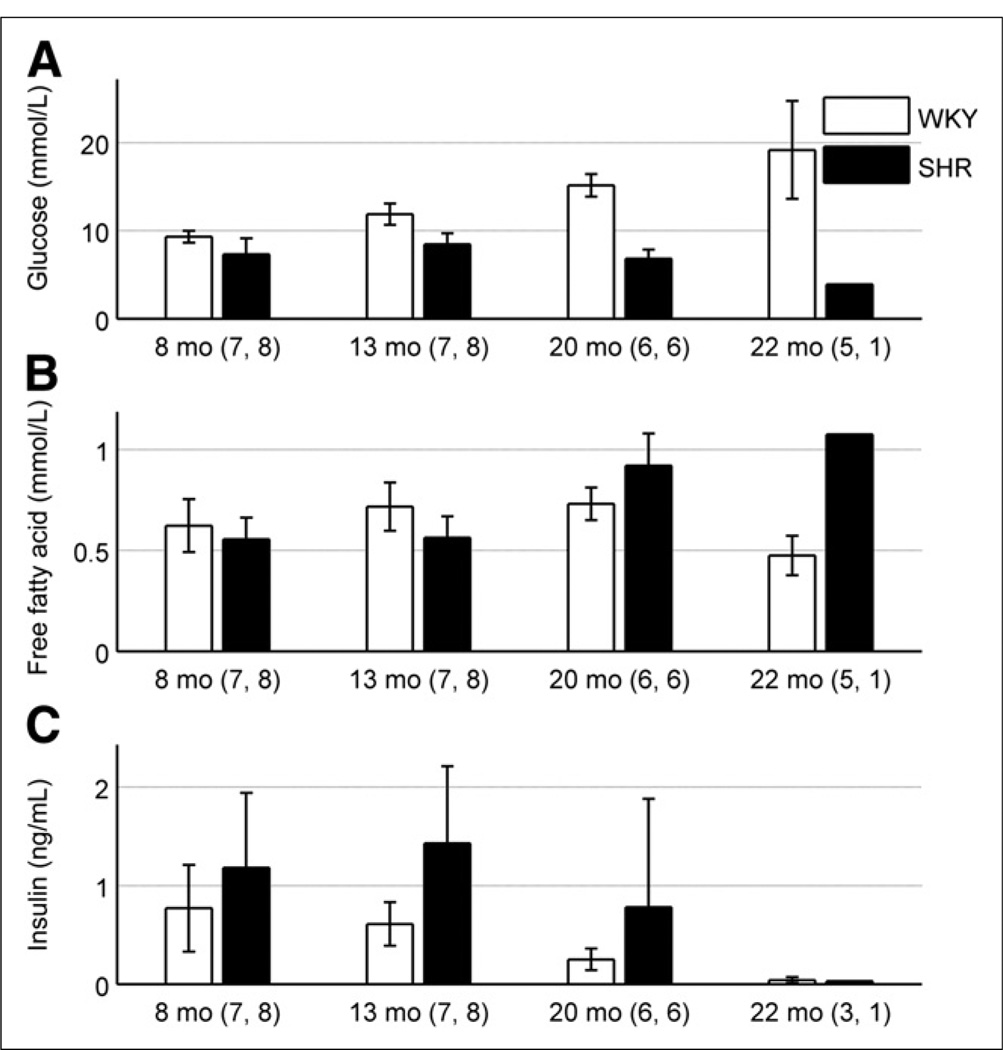
FIGURE 3.
(A) Glucose plasma concentration is shown as function of rat age in both models. SHR displayed lower glucose levels than control, independent of age (P < 6 × 10⁻¹²). Glucose levels in SHR demonstrated moderate age-dependent decrease whereas glucose levels in WKY rats increased with age (P < 2 × 10⁻⁵). (B) FFA plasma concentrations are shown. There was no significant difference between rat models independent of age (P = 0.374). SHR model indicated age-dependent increase in FFA levels, compared with fairly constant values for WKY rats with respect to age (P < 7 × 10⁻⁶). (C) Insulin-circulating plasma concentrations are shown as function of age. SHR showed higher insulin levels (P < 3 × 10⁻³), compared with control, and an age-dependent decrease was seen when both models were pooled together (P = 0.046). Numbers adjacent to age labels correspond to number of samples measured for WKY rats and SHRs, respectively, at given age.

