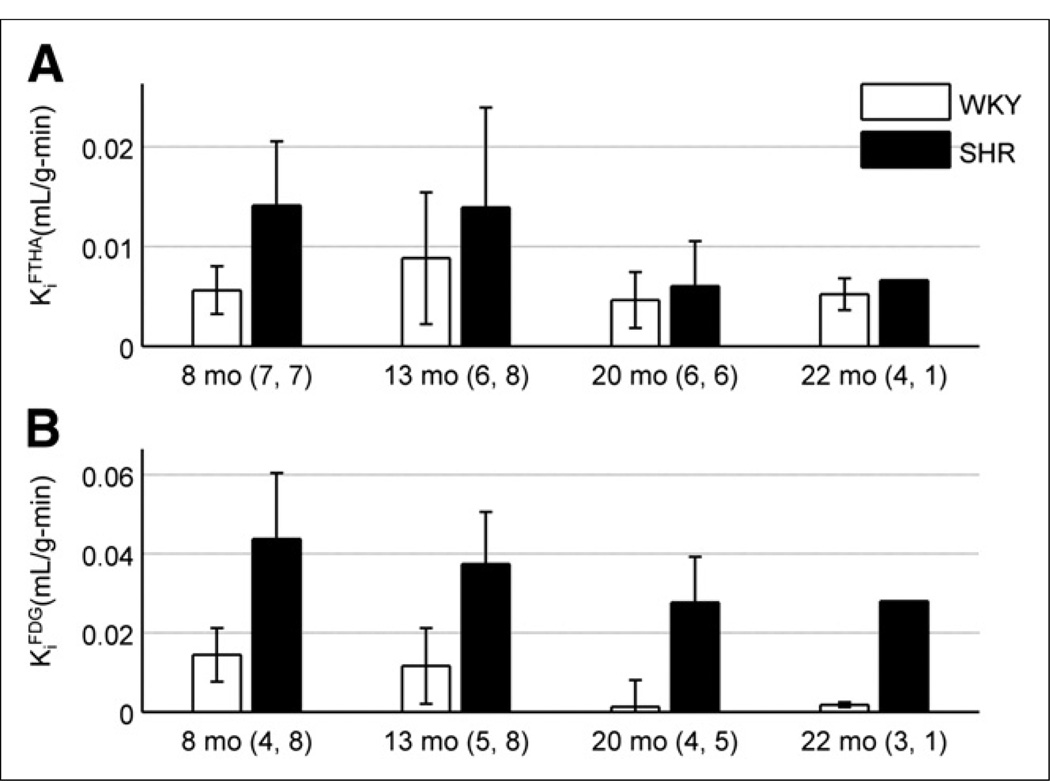
FIGURE 4.
(A) 18F-FTHA influx rate constant is shown as function of rat age for both models. SHR displayed higher KiFTHA than control (P = 0.005), but no statistically significant trend was seen with time (P = 0.087). (B) 18F-FDG influx rate constant is shown as function of rat age for both models. SHR demonstrated higher KiFDG than control when age was ignored (P < 3 × 10⁻⁸), and decrease was seen when all rat models were combined (P = 0.034). Numbers adjacent to age labels correspond to number of samples measured for WKY rats and SHRs, respectively, at given age.

