
Figure 7.
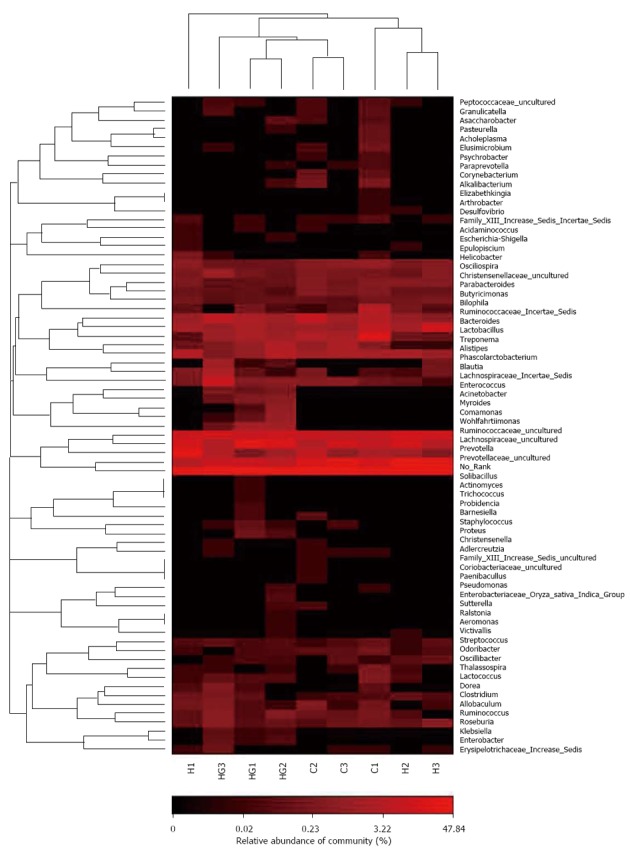
Bacterial distribution among the nine groups. Double hierarchical dendrogram showing the bacterial distribution among the nine groups. The bacterial phylogenetic tree was calculated using the neighbor-joining method and the relationship among samples was determined by Bray distance and the complete clustering method. The heatmap plot depicts the relative percentage of each bacterial family shown in the legend indicated at the bottom of the figure. Clusters based on the distance of the seven samples along the X-axis and the bacterial families along the Y-axis are indicated in the upper and left portions of the figure, respectively.