
Figure 2.
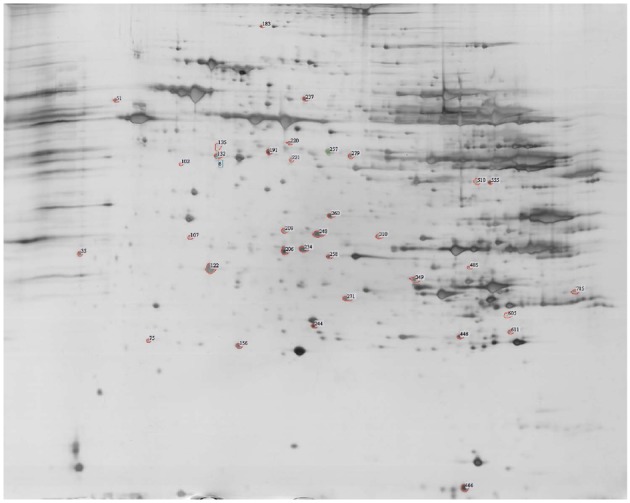
Representative two-dimensional electrophoresis image of proteins from the control and nonalcoholic steatohepatitis rat livers. The numbered spots denote proteins that exhibited modified expression levels in nonalcoholic steatohepatitis (NASH) liver.