
Figure 2.
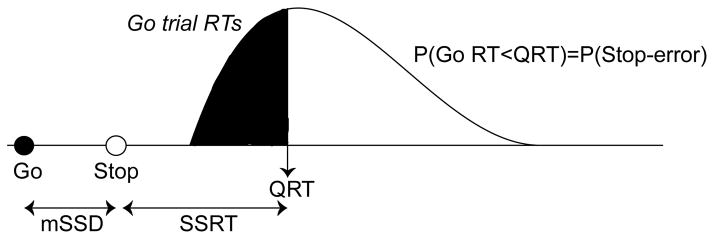
Stop-signal reaction time (SSRT) calculation. The proportion of failed inhibition trials, P(Stop-error), was calculated for each participant. The mean stop-signal delay (mSSD), represented by the delay between the stimulus to respond (filled circle) and the stop signal (empty circle), was calculated for the same participant. Then RTs from correct Go trials were sorted in ascending order, represented by the probability distribution in the figure. The quantile RT (QRT) was determined by finding the RT corresponding to P(Stop-error). Under race model assumptions, those Go trials that were left of the QRT (represented by the shaded area under the curve), would have been too fast to be inhibited, provided a stop signal was presented at mSSD following the Go signal. Likewise, the Go trials to the right of the QRT (represented by the empty area under the curve) would have been slow enough to be inhibited. The average SSD (mSSD) was then subtracted from the QRT in order to calculate SSRT.