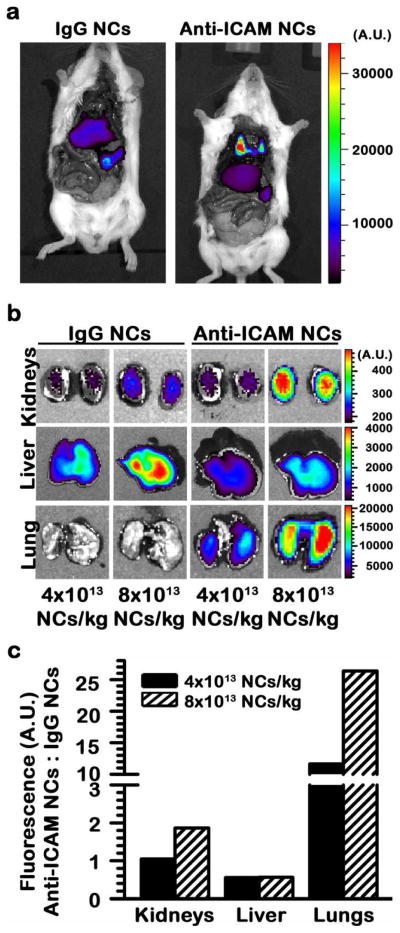
Figure 1.
Visualization of specific and dose-dependent targeting of anti-ICAM NCs in mice. (a) Optical imaging of mice 30 min after i.v. injection with FITC-labeled polymer nanocarriers coated with control IgG or anti-ICAM. (b) Optical imaging of organs isolated from mice 30 min after i.v. injection with model polymer nanocarriers (4×10¹³ or 8×10¹³ NCs/kg) labeled with FITC and coated with either control IgG or anti-ICAM, where the coat also bears a fraction of Alexa Fluor 750-labeled IgG as a near-infrared (NIR) tracer (shown in Supp. Fig. 2). (c) Semi-quantitative measurement of nanocarrier distribution, from optical imaging results shown in (b).

