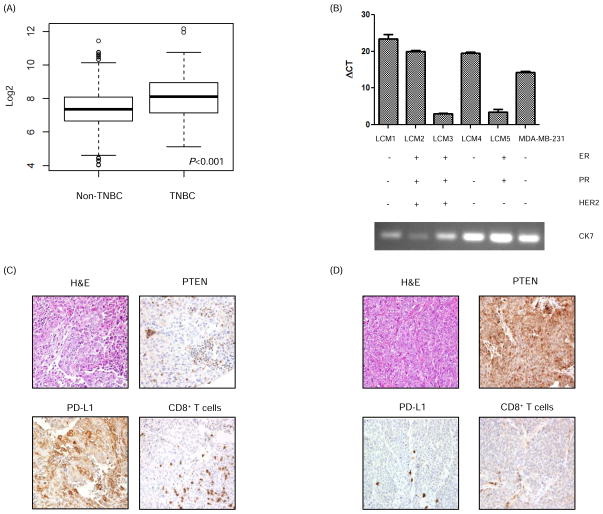
Figure 1. PD-L1 is expressed in breast cancer.
(A) Analysis of The Cancer Genome Atlas data demonstrated higher PD-L1 mRNA expression in breast tissue specimens from patients with TNBC (n=120) in contrast to patients with non-TNBC (n=716). Data are mean ± SD of PD-L1 mRNA expression. Analysis was done using a t test. Log2 expression of PD-L1 is shown on the y-axis. (B) PD-L1 mRNA expression (mean ± SD) in breast cancer patient tumors was measured using RT-PCR. RNA was extracted from breast cancer cells that were isolated from tumors using laser capture microdissection (LCM 1–5). Cytokeratin 7 (CK7) was used as a marker of breast cancer to confirm the source of the extracted RNA. MDA-MB-231 was used as a positive control for PD-L1. (C) Representative TNBC patient tumor tissues showing loss of PTEN expression and high PD-L1 expression in tumor cells, and a significant CD8+ T cell infiltrate in contrast with another TNBC patient tissue (D) which shows high PTEN expression in breast tumor cells, no PD-L1 expression in tumor cells, minimal PD-L1 expression in associated inflammatory cells, and minimal intratumoral CD8+ T cell infiltrate. Magnification = 100x.

