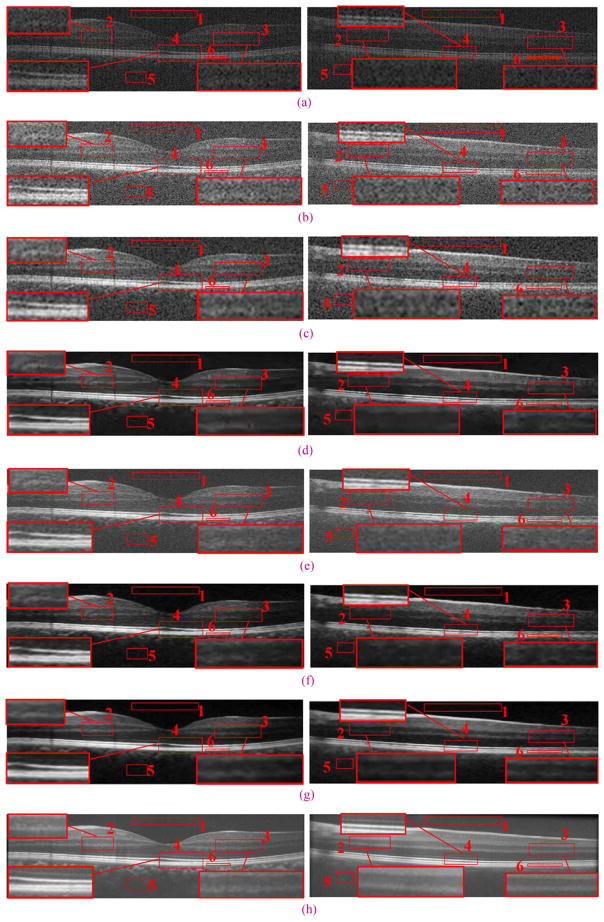
Fig. 10.
An example real experimental dataset with results reconstructed by Tikhonov [63], Bicubic, BM3D [64]+Bicubic, 2-D-SBSDI-nomap, 2-D-SBSDI, and SBSDI method. The left and right columns show images from the fovea and 1.5 mm below the fovea area, respectively. (a) Original images (b) bicubic reconstruction (Left: PSNR = 18.51, Right: PSNR = 17.84). (c) Tikhonov [63] reconstruction (Left: PSNR = 23.07, Right: PSNR = 21.99). (d) BM3D [64]+Bicubic reconstruction (Left: PSNR = 26.33, Right: PSNR = 23.24). (e) 2-D-SBSDI-nomap reconstruction (Left: PSNR = 25.06, Right: PSNR = 22.46). (f) 2-D-SBSDI reconstruction (Left: PSNR = 26.20, Right: PSNR = 23.10). (g) SBSDI reconstruction (Left: PSNR = 26.77, Right: PSNR = 23.52). (h) Registered and averaged images which were acquired 80 times slower than the image in (g).

