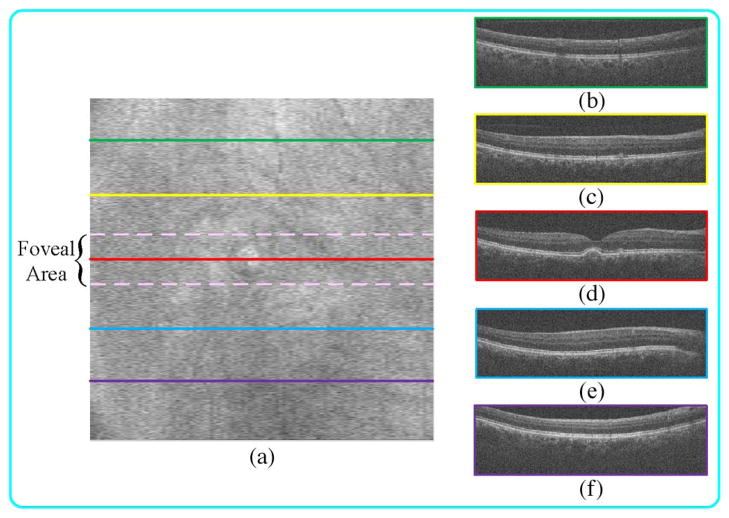
Fig. 5.
SDOCT B-scan acquired from the fovea (d) often have more complex structures than those in periphery regions (b), (c), (e), (f). (a) Summed-voxel projection [51] (SVP) en face SDOCT image of a nonneovascular age-related macular degeneration (AMD) patient. (b), (c), (e), (f) B-scans acquired from the green, yellow, blue, and purple lines (periphery regions). (d) B-scan acquired from the red line (fovea region).

