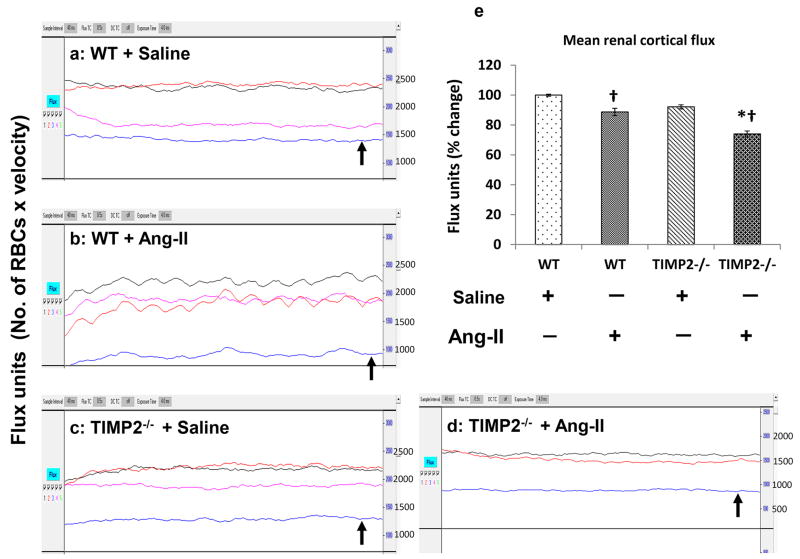
Figure 2. Renal cortical blood flow decreases in TIMP2-/- mice in Ang-II-induced hypertension.
Figure shows Laser Doppler flowmetry (flux units: No. of RBCs × velocity) in aorta (Black trace), renal artery (Red trace), renal vein (purple trace) and renal cortex (blue trace). (a) & (c) represent WT and TIMP2-/- mice respectively treated with saline, and (b) & (d) represent Ang-II treated WT and TIMP2-/- mice respectively. Bar graph (e) represent the mean flux units (No. of RBC × velocity) as percentage change in the renal cortex ± SEM (n=6/group). Values were plotted using WT + saline as control. *p < 0.05 vs. WT + Ang-II; †p < 0.05 vs. WT and TIMP2-/- with saline treatment.

