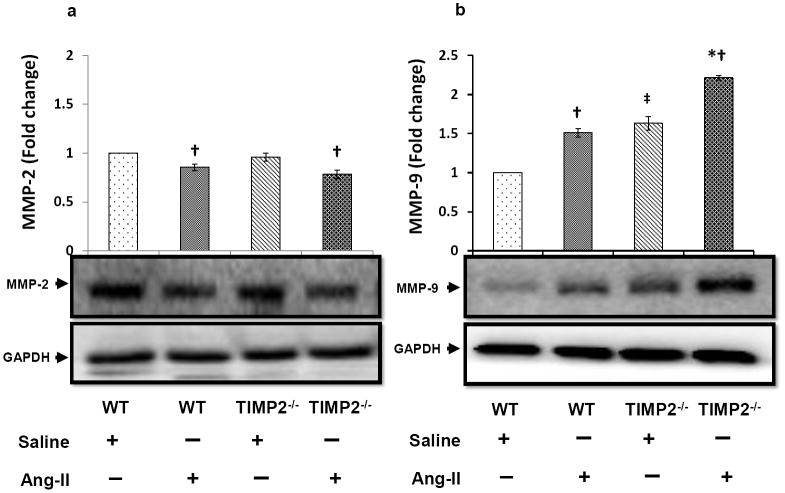
Figure 6. MMP-2 is down regulated, whereas MMP-9 is up regulated in Ang-II induced hypertension.
Tissue extracts were prepared and analyzed for immunoblotting to determine expression of matrix metalloproteinase-2 and -9 (MMP-2 and -9) in the kidney as described in the Materials and Methods. Fifty microgram of protein from each group was separated by SDS-PAGE and immunoblotted using rabbit anti-MMP-2 (a) and anti-MMP-9 (b) antibody. GAPDH was used as a loading control. The pixel densities of the bands were quantified using ImageJ software (National Institute of Health (NIH)) and presented as fold change in the bar diagrams. Data represents normalized mean expression ± SEM (n=6/group); *p < 0.05 vs. WT + Ang-II; †p < 0.05 vs. WT and TIMP2-/- given saline treatment; ‡p < 0.05 vs. WT + Saline.

