
Figure 3.
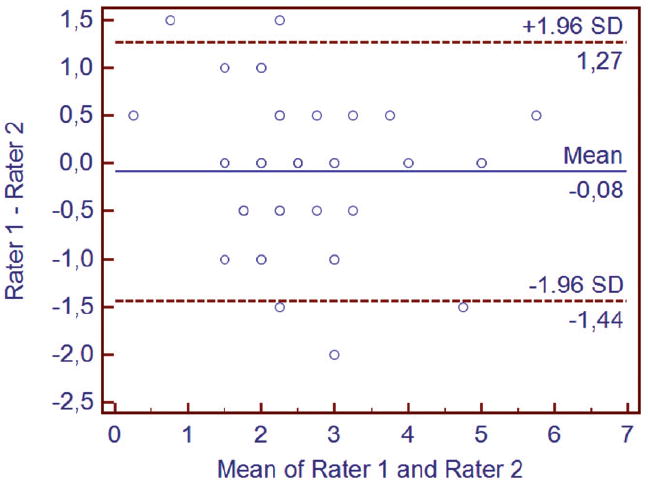
Bland and Altman plot displaying the difference in the M-WCAS measurements plotted against the mean M-WCAS measurements.
Official websites use .gov
A
.gov website belongs to an official
government organization in the United States.
Secure .gov websites use HTTPS
A lock (
) or https:// means you've safely
connected to the .gov website. Share sensitive
information only on official, secure websites.
Bland and Altman plot displaying the difference in the M-WCAS measurements plotted against the mean M-WCAS measurements.