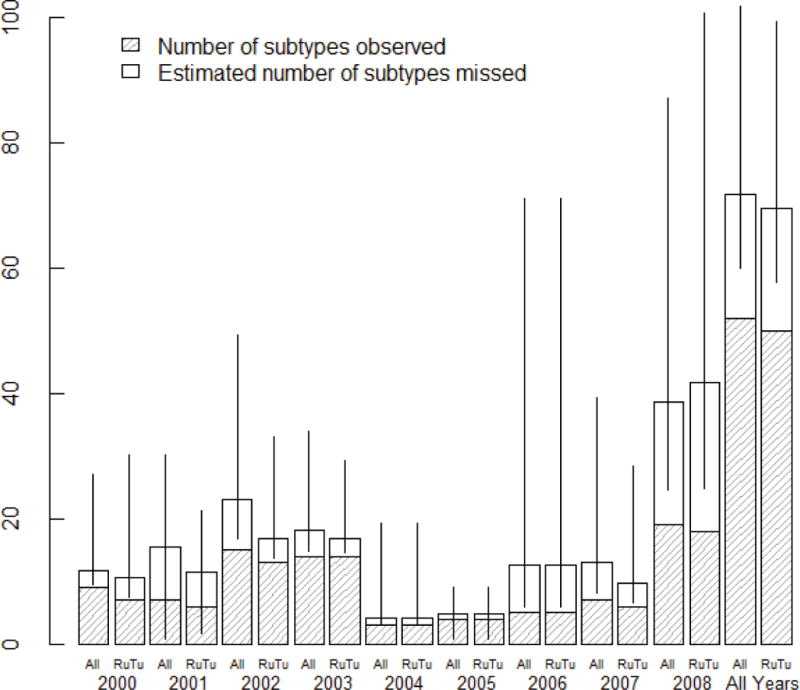
Figure 2.

Barplot indicating the number of observed subtypes (i.e. subtypes collected) and number of subtypes missed at Delaware Bay for each year and for all years combined for all species at Delaware Bay and for Ruddy Turnstones only. Estimated number of subtypes (ACE) incorporates both observed subtypes and missed subtypes. Error bars indicate the 95% confidence intervals for ACE estimates. Note that for 2001 and 2005, the Chao 1 estimate is used in place of the ACE estimate. Also note that for 2005, the number of missed subtypes is 0 and the confidence intervals are (4.0, 4.07). These data suggest high variability in LPAI subtypes among years regardless of whether the entire host community is sampled or just Ruddy Turnstones are sampled.
