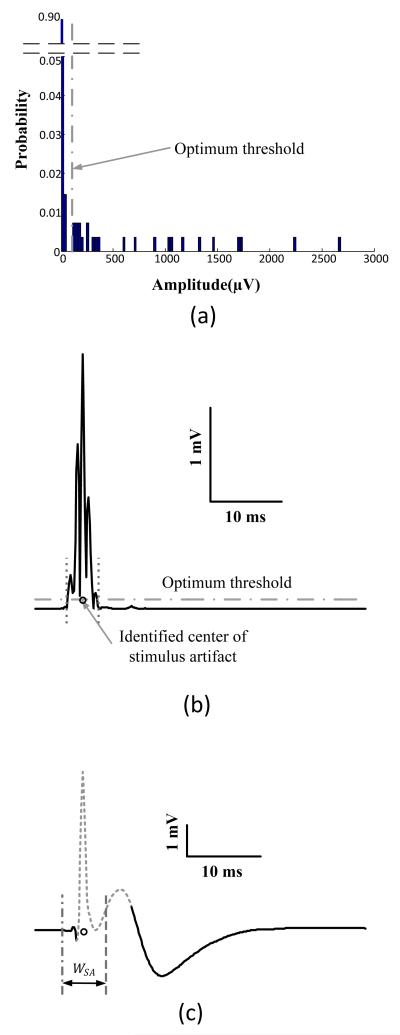
Figure 3.
Illustration of locating stimulus artifact with the Otsu thresholding. (a) Otsu thresholding of the residual signal (demonstrated in Figure 2d) to determine the optimum threshold for discrimination of M wave and stimulus artifact. (b) Locating the center of the stimulus artifact as the middle point of the set of consecutive data points above the optimum threshold; (c) Defining the stimulus artifact contaminated region of width WSA.

