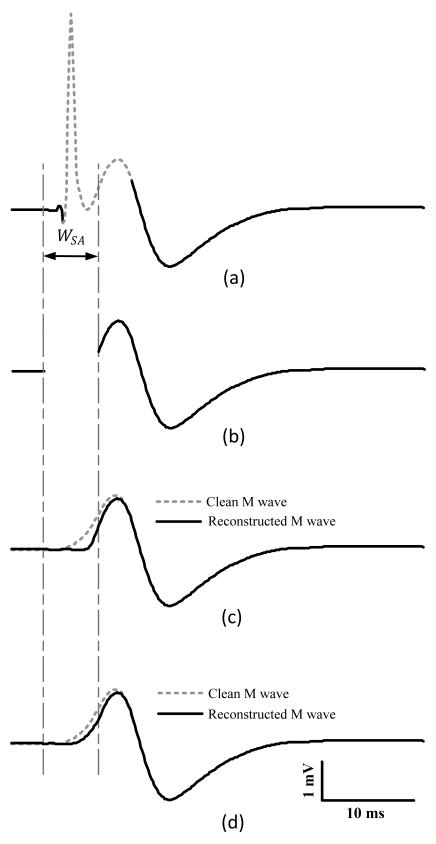
Figure 4.
Illustration of M wave reconstruction. (a) The M wave with identified region of artifact contamination; (b) The artifact contaminated region was removed from the signal; (c) Reconstruction of the removed region with piecewise cubic Hermite interpolation; (d) Reconstruction of the removed region with a 23-point sliding-average smoothing filter after signal interpolation.

