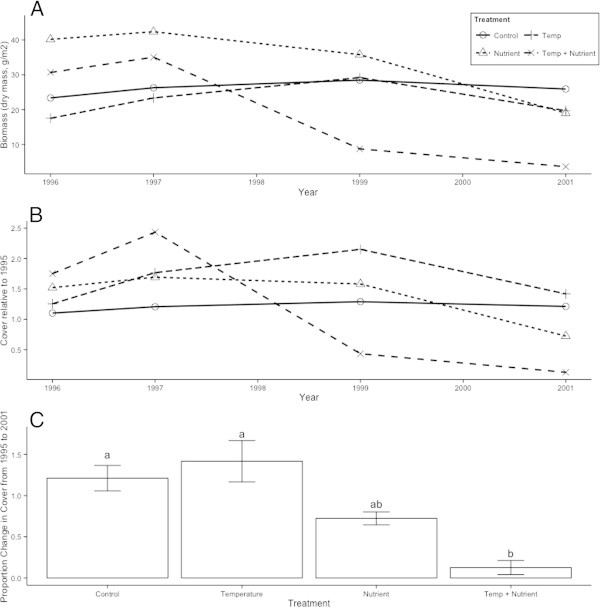
Figure 3.

S. acaulis biomass and cover response to simulated global change. (A) Dry biomass of S. acaulis in simulated global change treatments from 1996 through 2001. (B) Changes in S. acaulis cover relative to 1995, the first year of the study; for all years except 2001, there were no significant differences between treatments. (C) Proportion of original cover extent at the end of the study in 2001, with different letters indicating significant differences between treatments in posthoc testing (p < 0.05).
