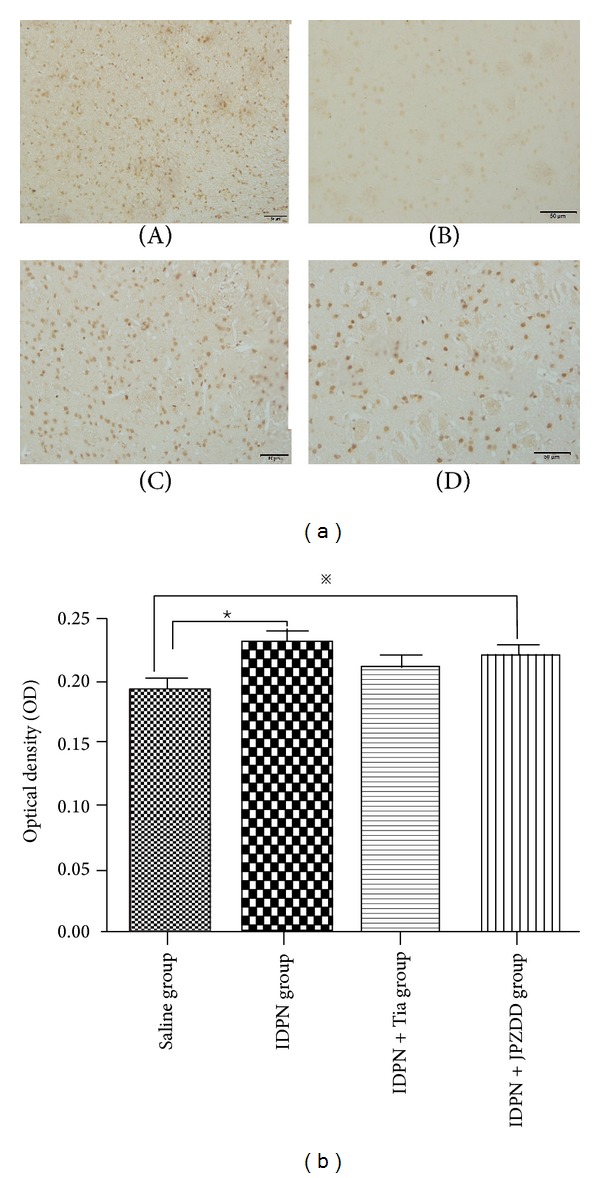
Figure 3.

Immunohistochemistry of GABAAR in the striatum. (a) Comparison of the GABAAR in different groups, (A) IDPN group, (B) saline group, (C) IDPN+Tia group, and (D) IDPN+JPZDD group. Magnification 20 x. (b) The optical density was quantified. The bar graphs represent data from 24 different animals. Data were shown as mean ± SEM (n = 6 mice/group). ※ represents P values <0.05; ★ represents P values <0.01.
