Figure 4.

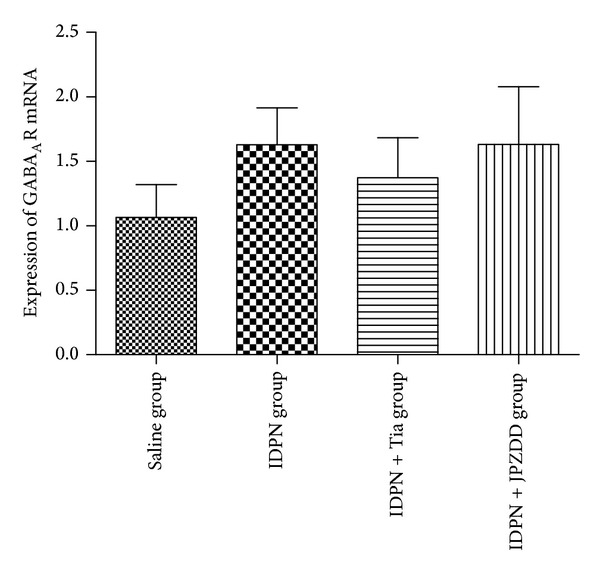
Expression of GABAAR mRNA expression in the striatum. The bar graphs represent data from 24 different animals. Data were shown as mean ± SEM (n = 6 mice/group).

Expression of GABAAR mRNA expression in the striatum. The bar graphs represent data from 24 different animals. Data were shown as mean ± SEM (n = 6 mice/group).