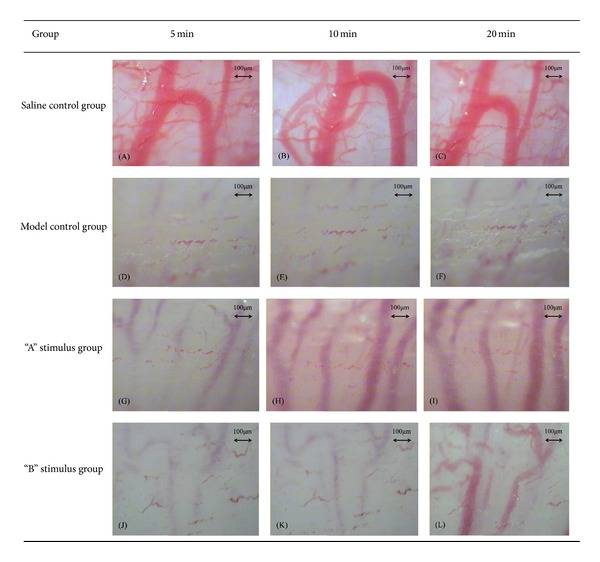
Figure 5.

(A), (B), and (C) show the uterine microvascular diameter of saline control group under 40x magnification vision and the diameter nearly without any change during observation period. (D), (E), and (F) show the uterine microvascular diameter of model control group, the diameter nearly disappeared, and without any change during observation period. (G), (H), and (I) show the changes of uterine microvascular diameter of “A” stimulus group, especially after the hand manipulation of needle at 10 min as the diameter expanded significantly. (J), (K), and (L) show the changes of uterine microvascular diameter of “B” stimulus group, compared with the “A” stimulus group and “B” stimulus group without hand manipulation stimulus at 10 min, but at 20 min; we also can see that the diameter had expanded.
