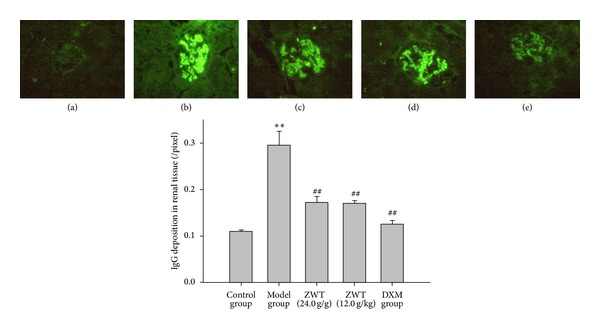
Figure 4.

ZWT decrease the IgG deposition in renal tissue. Magnification, ×400. (a) Control group (treated with saline); (b) model group (treated with ADR); (c) ZWT group (treated with ZWT, 24.0 mg/kg); (d) ZWT group (treated with ZWT, 12.0 mg/kg); (e) DXM group (treated with dexamethasone, 0.9 mg/kg). Data were expressed as mean ± SD, n = 6. Vertical bars represent standard errors of the means. Asterisks and pound signs designate significant differences: # P < 0.05 and ## P < 0.01 versus model and *P < 0.05 and **P < 0.01 versus control.
