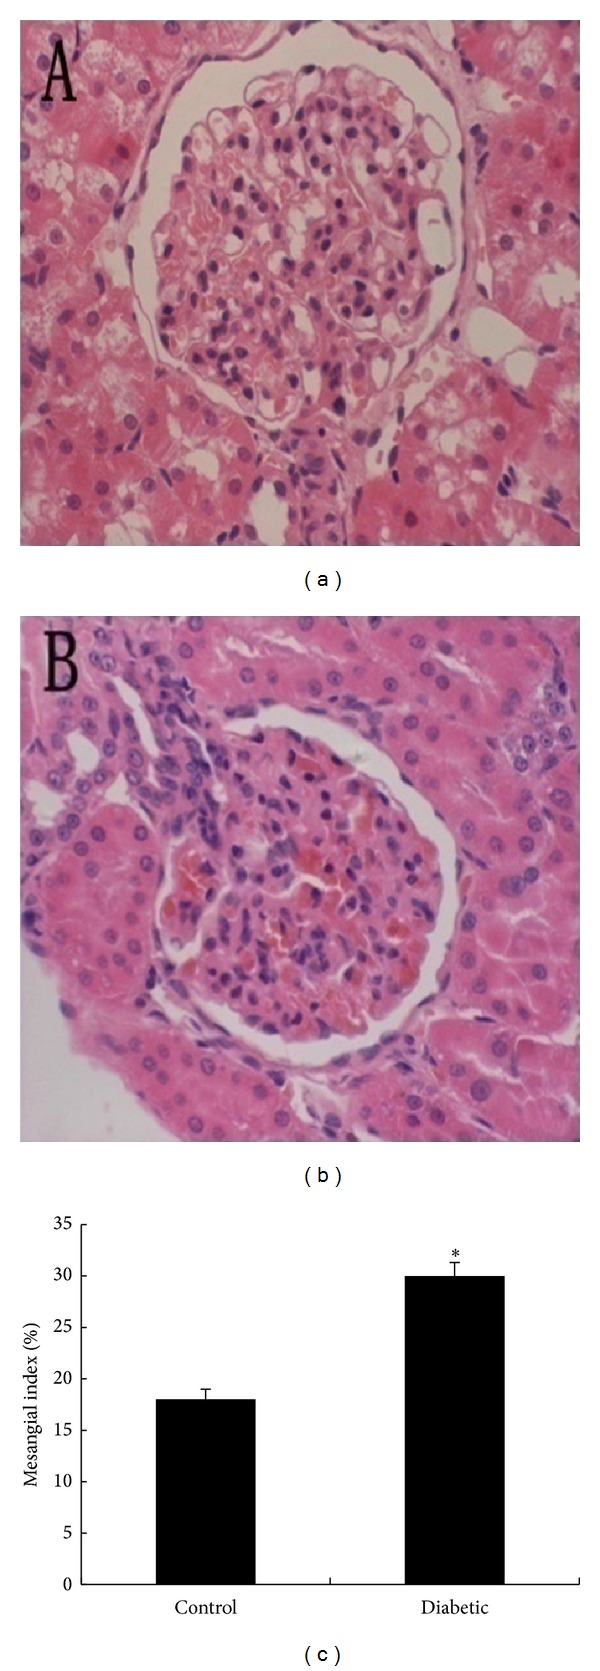
Figure 2.

(a)-(b) Representative light microscopy images of glomeruli (original magnification, 400×) in nondiabetic control rats (a) and diabetic rats (b). (c) Mesangial index in control and diabetic rats, expressed quantitatively by calculating the percentage of the total glomerular area. *P < 0.01 versus (c) n = 6 for each group. Each column represents the mean ± SD.
