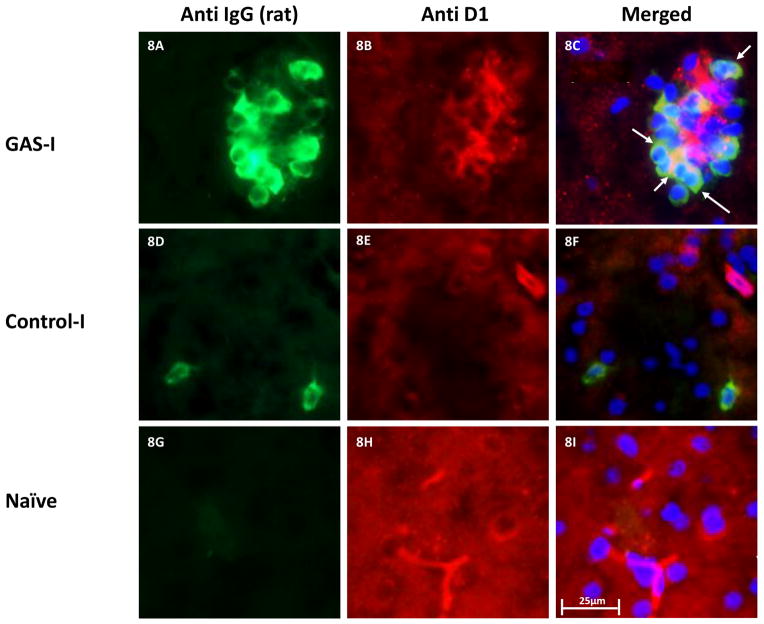
Figure 8.
Representative immunofluorescence images showing IgG deposition in the striatum of a GAS-I rat (A–C), Control-I rat (D–F) and naïve rat (G–I) and double labeling with anti-D1 dopamine receptor antibody. Figures A, D and G display labeling of rat IgG; Figures B, E and H display labeling of the D1 dopamine receptor; Figures C, F and I display colocalization of the rats IgG and the D1 dopamine receptor. Tissue sections were incubated with anti-rat alexa antibody 488 for visualization of IgG deposition; IgG against the D1 dopamine receptor was labeled with anti-rabbit alexa antibody 594. Blue signal indicates nuclear counterstaining (DAPI). 40 × microscope objective; scale bar=25μm. The arrows point to colocalization between the infused IgG and D1.

