
Fig. 4.
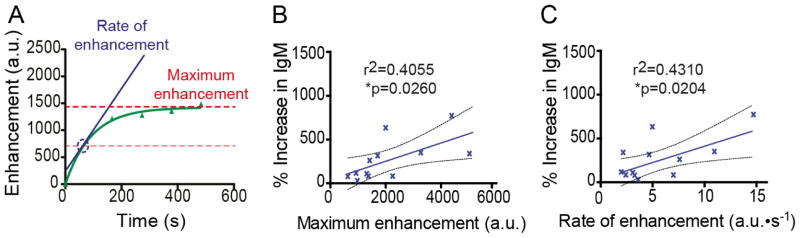
Increases in IgM are proportional to the enhancement in MRIgFUS-treated cortical regions. A, Using enhancement data gathered from MRI post-treatment scans, the estimated maximum enhancement (red) and rate of enhancement (blue) can be determined for all MRIgFUS-treated mice (representative enhancement graph for one mouse). B, The maximum enhancement, representative of the maximum amount of gadolinium able to enter the brain after BBB opening, was positively correlated to the increase in IgM levels measured in the MRIgFUS-treated cortex of the same mice (r2=0.4055, p=0.026, n=12). C, Similarly, the increase of endogenous IgM detected within the MRIgFUS-treated cortex was correlated to the rate of enhancement (r2=0.4310 p=0.020, n=12), which is indicative of the speed at which gadolinium enters the brain. Dashed lines indicate a 95% confidence intervals (B–C).