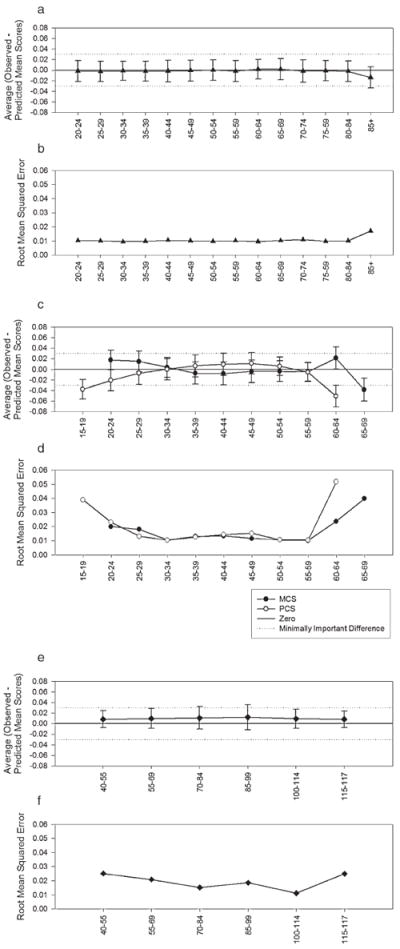
Figure 2.

Average difference in observed and predicted SF-6D score and root mean squared error by age, mental component summary (MCS) score, physical component summary (PCS) score, and summed MCS and PCS score. Each point represents 500 groups of 50 observations that were randomly selected from the 2001 MEPS. Inclusion in the groups was constrained by either age, MCS score, or PCS score. The difference between the observed average SF-6D score of the group and the predicted average SF-6D score was calculated. This figure illustrates the mean of these differences with 95% confidence intervals by age strata (a), MCS score strata or PCS score strata (c), and sum of MCS and PCS score strata (e). This figure also illustrates the mean squared error of by age strata (b), MCS score strata or PCS score strata (d), and sum of MCS and PCS score strata (f).
