
Figure 3.
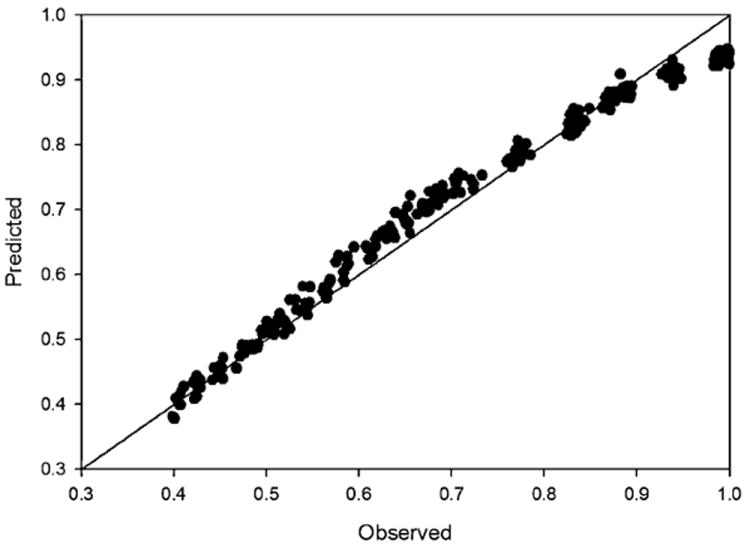
Observed and predicted mean SF-6D scores for groups with 50 observations. This figure illustrates the mean observed and mean predicted SF-6D scores for groups of 50 observations were randomly selected from the 2001 Medical Expenditure Panel Survey. SF-6D group strata included 0.30–0.45, 0.325–0.475, 0.35–0.5, 0.375–0.525, 0.40–0.45, 0.425–0.575, 0.45–0.6, 0.475–0.625, 0.50–0.45, 0.525–0.675, 0.55–0.7, -0.575–0.725, 0.60–0.45, 0.625–0.775, 0.65–0.8, 0.675–0.825, 0.70–0.45, 0.725–0.875, 0.75–0.9, 0.775–0.925, 0.80–0.45, 0.825–0.975, 0.85–1.0, 0.875–1.0, 0.90–1.0, 0.925–1.0, and 0.95–1.0. Ten groups were randomly selected from each of the strata.