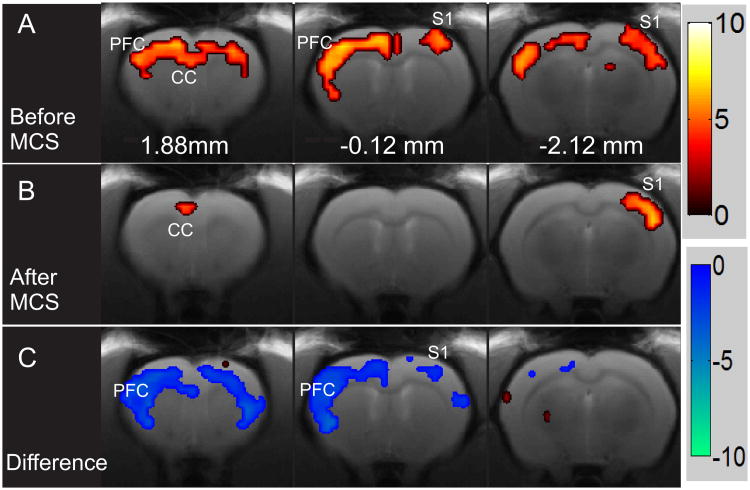
Figure 4.
A representative example of activation maps produced by electrical stimulation of the hindpaw before and after MCS. (A) Activation maps produced by electrical stimulation of the right hindpaw before and after MCS; (B) in the same animal. (C) The difference in activation maps before and after MCS in the same animal presented in A and B. All activation maps were obtained with thresholds of family wise error-corrected p < 0.05 and contiguous voxels > 5. Red color bar shows the positive statistic T value. Blue color bar is the negative statistic T value.

