Abstract
A biopsy of the first lymph node to which a tumor drains – the sentinel lymph node (SLN) – is commonly performed to identify micrometastases. Image guidance of the SLN biopsy procedure has the potential to improve its accuracy and decrease its morbidity. We have developed a new stable contrast agent for photoacoustic image-guided SLN biopsy: silica-coated gold nanoplates (Si-AuNPs). The Si-AuNPs exhibit high photothermal stability when exposed to pulsed and continuous wave laser irradiation. This makes them well-suited for in vivo photoacoustic imaging. Furthermore, Si-AuNPs are shown to have low cytotoxicity. We tested the Si-AuNPs for SLN mapping in a mouse model where they exhibited a strong, sustained photoacoustic signal. Real-time ultrasound and photoacoustic imaging revealed that the Si-AuNPs quickly drain to the SLN gradually spreading throughout a large portion of the node.
1. Introduction
Identifying the spread of cancer cells from the primary tumor is a critical factor for diagnosis and treatment planning. The standard of care for detection of cancer cells in the lymphatic system is a sentinel lymph node (SLN) biopsy.[1] In a typical SLN biopsy, a combination of an optically absorbing dye and a radioactive tracer is injected peritumorally and allowed to drain through the lymphatic vessels. The first lymph node to which the dye/tracer drains is known as the SLN. Histology is performed on the entire or part of the SLN to detect the presence of metastatic cancer cells. Although the procedure increases the survival of cancer patients, it often results in nerve damage and lymphedema.[2, 3] A number of imaging methods, including magnetic resonance imaging, fluorescence imaging, and ultrasound (US) imaging, have been proposed to improve the accuracy and decrease the morbidity of SLN mapping.[4–6] These methods, however, lack the resolution, imaging depth, or sensitivity which is desired for SLN mapping.
Photoacoustic (PA) imaging is a promising solution in that it provides inexpensive, real-time, non-ionizing screening capabilities with imaging depths of up to several centimeters. Furthermore, it has the capability to provide functional information (e.g., hemoglobin oxygen saturation), or, with the addition of molecularly-targeted contrast agents, a mapping of biomolecules of interest.[7–12] This unique versatility makes PA imaging well-suited for imaging of the lymphatic system. Contrast in PA imaging is derived from variations of the optical absorption in the tissue.[13] Strongly absorbing molecules, including hemoglobin, melanin, dyes and plasmonic nanoparticles, generate a strong photoacoustic signal when irradiated with a nanosecond pulsed laser.[14] This signal can be detected with a clinical ultrasound transducer, and an image is formed via various image reconstruction algorithms.
The fluid in the lymphatic system is minimally absorbing and thus provides no intrinsic PA contrast. Therefore, a contrast agent, such as a dye or nanoparticle, must be used to map the SLN.[15, 16] Plasmonic nanoparticles are particularly promising for PA imaging because they are easily synthesized with a tunable peak optical absorption wavelength, are easily conjugated for molecular targeting, and have a molar optical absorption that is five orders of magnitude greater than dyes.[17–19] Anisotropic nanoparticles are commonly used in PA imaging applications because they absorb light in the red to near infrared range where the optical attenuation of tissue and endogenous PA signal are at a minimum.[20] Previously, both gold and silver nanoplates have been proposed for PA imaging because of their high optical absorption, simple synthesis, and ability to be easily targeted to cellular receptors.[18, 21, 22] Indeed, the large size of gold nanoplates means they have a higher per-particle absorption than nanorods and are well suited for drainage through the lymphatic system.[23] These nanoparticles can be differentiated from the background endogenous absorbers either by observing a relative increase in signal or by performing spectroscopic PA imaging.[15, 20, 21] The methods of localizing contrast agents, however, have limitations which will impede their eventual clinical translation. If the endogenous absorbers in the tissue produce a large PA signal, then measuring signal changes can become unreliable. Conversely, spectroscopic PA imaging requires significant increases in the complexity of the instrumentation and longer image acquisition times.
Here we present a new contrast agent for improved PA SLN mapping: silica-coated gold nanoplates (Si-AuNPs). These particles exhibit excellent PA contrast near their peak plasmon resonance. Therefore, the Si-AuNPs can be easily localized using only a single wavelength – 1064 nm – to acquire PA images. Thus, complicated imaging techniques are avoided. Furthermore, the silica coating provides a protective shell that preserves the thermodynamic stability of the particles during sustained PA imaging. By combining all of these useful characteristics, Si-AuNPs enable accurate, real-time visualization of the SLN.
2. Results and Discussion
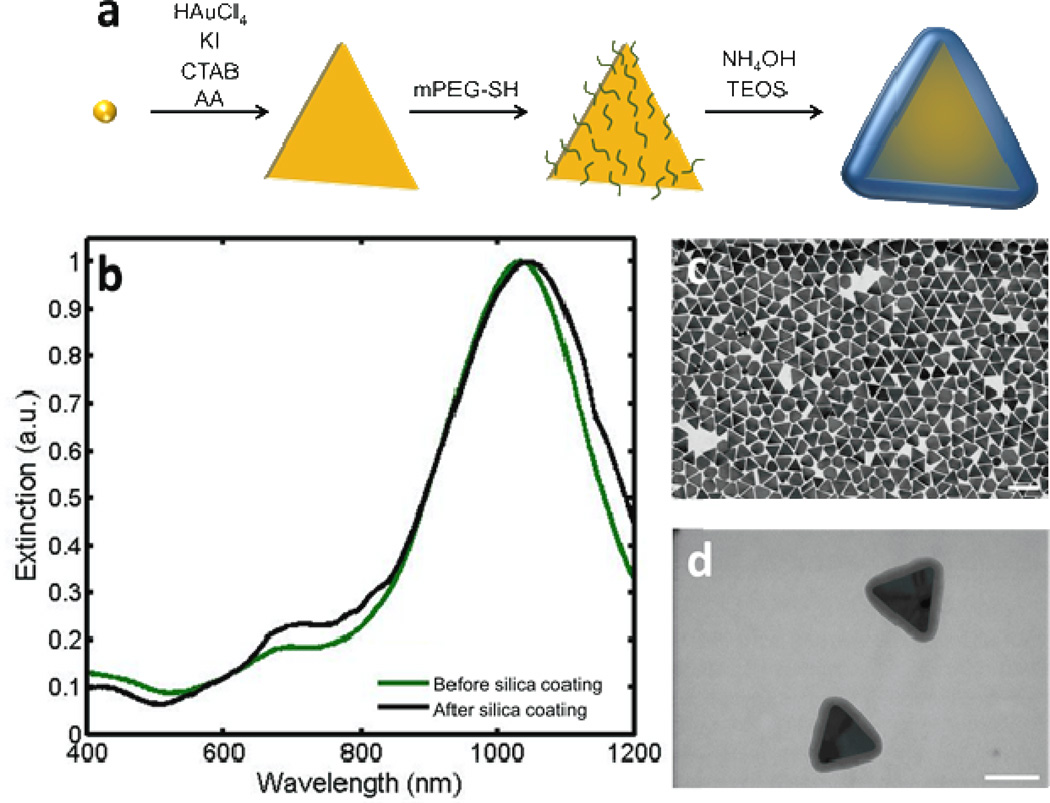
We synthesized the gold nanoplates (AuNPs) through a seed-mediated approach (Fig. 1a) adapted from Ha, et al.[24] The peak absorption of the AuNPs was tuned to 945 nm. After the removal of extraneous byproduct nanospheres and small AuNPs,[25] the peak shifted to 1035 nm (Fig. 1b). Transmission electron microscopy (TEM) images show an even distribution of AuNPs with a mean edge length of 96 ± 5 nm (Fig. 1c). This size of particle has been shown to be well-suited for delivery to the SLN through the lymphatic system.[23] After PEGylation, the AuNPs were coated with a thin (5 to 20 nm) layer of silica. The thickness of the silica layer was controlled by adjusting the duration of the reaction. The addition of the silica layer is evidenced through a redshift in the absorption spectrum (Fig. 1b) and the TEM images before (Fig. 1c) and after (Fig. 1d) silica coating. Si-AuNPs were stable with no signs of aggregation after several weeks when stored in an aqueous solution at room temperature.
Figure 1.
a) Schematic showing the synthesis of Si-AuNPs. b) UV-Vis-NIS spectra of NPs before (green) and after silica coating (black). c) A TEM image of AuNPs shows an even size distribution (scale bar = 200 nm). d) A TEM image of Si-AuNPs (scale bar = 100nm).
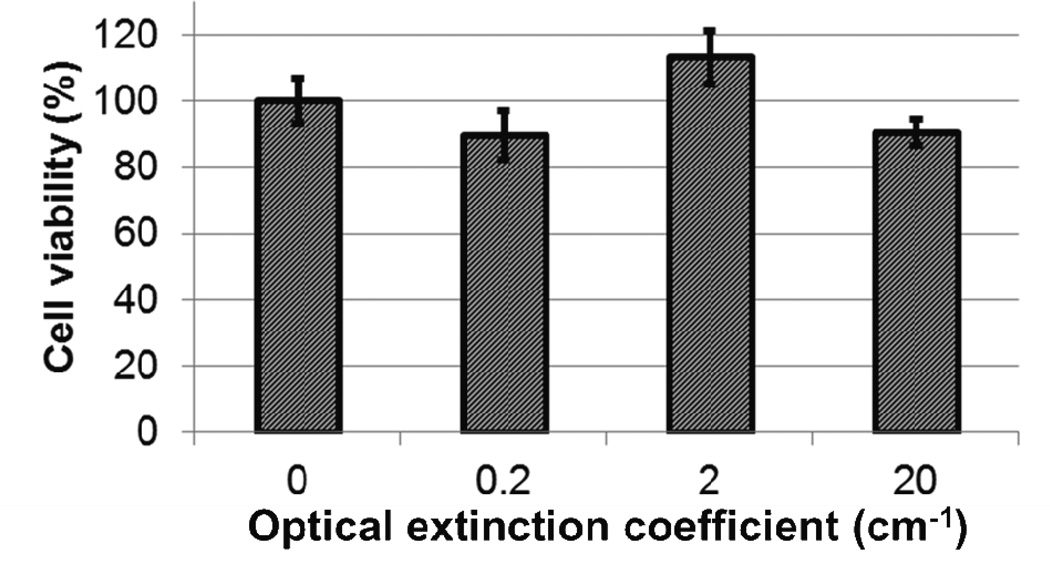
Prior to performing in vivo studies, we measured the cytotoxicity of the Si-AuNPs with a 3–4,5-dimethylthiazol-2-yl)-5-(3-carboxymethoxyphenyl)-2-(4-sulfophenyl)-2H-tetrazolium (MTS) assay. We incubated Si-AuNPs at various concentrations (peak optical extinction coefficients of 0.2, 2, or 20 cm−1) with L3.6pl pancreatic cancer cells for 48 hours. Even the highest concentration of Si-AuNPs shows no statistically significant changes in cell viability (Fig. 2).
Figure 2.
An MTS assay shows no significant cytotoxicity of Si-AuNPs at concentrations with optical extinction coefficients up to 20 cm−1 in comparison to control.
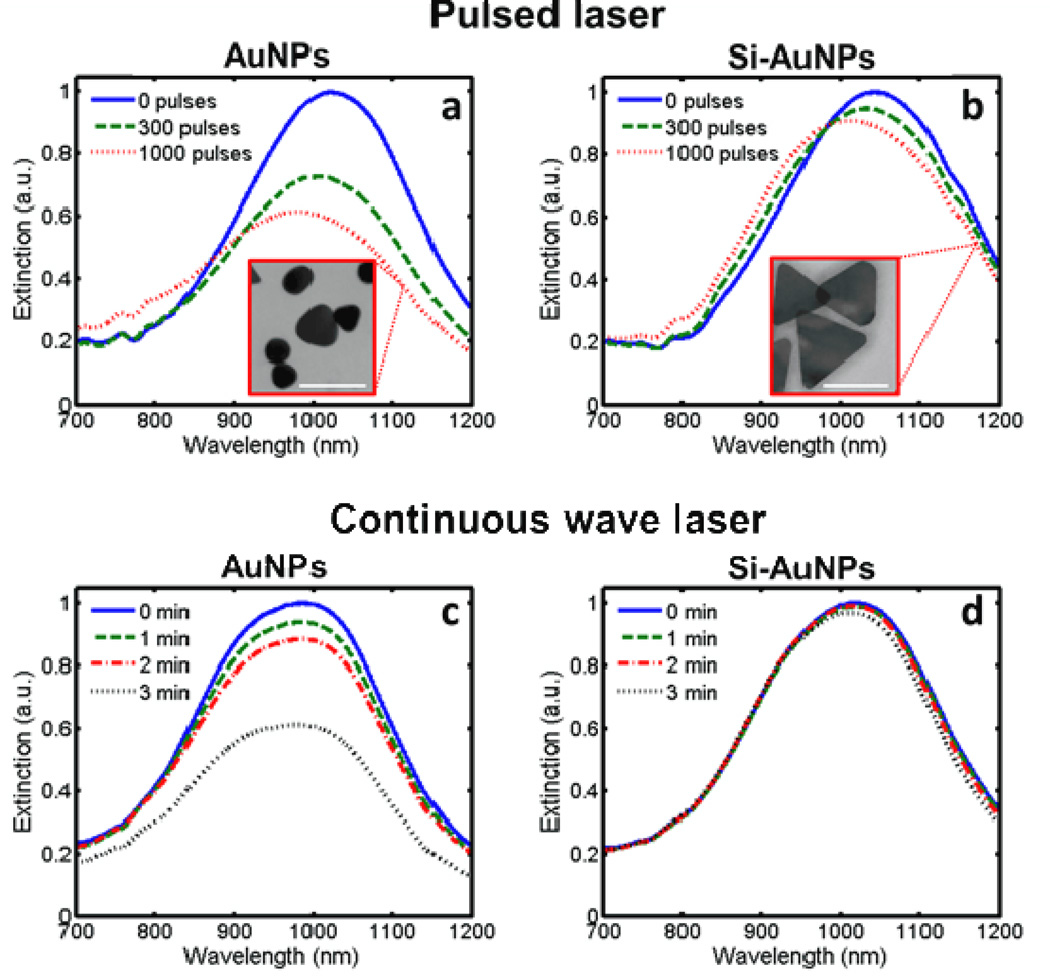
We tested the stability of the Si-AuNPs under pulsed and continuous wave laser irradiation. PEGylated AuNPs and Si-AuNPs with a silica thickness of 20 nm (as measured in TEM images) were irradiated with either a pulsed laser with a fluence of 10 mJ/cm2 or a continuous wave (CW) laser with a fluence rate of 5 W/cm2. The stability of the particles depended on the presence of the silica layer and the duration of the laser exposure (Fig. 3). The optical extinction of the PEGylated AuNPs at 1064 nm decayed by 45% under irradiation of 1000 laser pulses (Fig. 3a). The peak absorption wavelength also blue-shifted by 40 nm. The TEM image indicates that the decreases in the optical absorption can be attributed to changes in morphology of the AuNPs (Fig. 3a, inset). The particles become more spherical after irradiation while smaller AuNPs (whose plasmon resonance is likely lower than 1064 nm) remain intact. This behavior suggests that sustained PA imaging of PEGylated AuNPs may not be feasible. In contrast, the Si-AuNPs show significantly better stability under exposure to pulsed laser irradiation with only a 13% decrease in extinction at 1064 nm observed (Fig. 3b). After irradiation, the morphology of the Si-AuNPs was much better preserved (Fig 3b, inset). Only minor changes of the shape of a small fraction of the Si-AuNPs were identified. This drastic enhancement of stability clearly improves the utility of Si-AuNPs for sustained PA imaging.
Figure 3.
UV-Vis-NIR spectra showing the degradation of PEGulated AuNPs and Si-AuNPs to a,b) pulsed laser irradiation at 10 mJ/cm2 and c,d) continuous wave laser irradiation at 1.3 W/cm2. The pulsed laser caused significant changes in the morphology of PEGylated AuNPs (a, inset) while Si-NPs with 20-nm layer of silica showed few changes in shape (b, inset). Scale bars = 100 nm.
Similar improvements in particle stability were observed upon exposure to a CW laser. The extinction of PEGylated AuNPs at 1064 nm degraded 49% after 3 minutes of CW laser irradiation (Fig. 3c). Si-AuNPs, on the other hand, experienced very little change in their absorption spectrum; the optical extinction decreased by only 6% (Fig. 3d). This indicates that the addition of silica to AuNPs improves their efficacy for CW laser applications, such as photothermal therapy.
These experiments show the silica shell helps to protect the Si-AuNPs against laser-induced photothermal degradation. Indeed, the degree of improvement in stability is comparable to previous studies with silica-coated gold nanorods. [26, 27] These studies have shown that the increased stability is likely due to more efficient exchange of thermal energy from the nanoparticle to the surrounding medium resulting from a lower interfacial heat resistance resulting from the silica layer.[28] Because the bulk of the PA signal is generated in the medium, rather than the AuNP, the lower interfacial heat resistance also has the benefit of significantly improving the PA signal generated.[29]
For SLN imaging, a model of squamous cell carcinoma of the oral cavity was adapted; however, only normal (non-tumor-bearing mice) were used in this study.[30] Combined ultrasound and photoacoustic (USPA) imaging was performed on the cervical lymph nodes located near the salivary glands of the mice. The Si-AuNPs were injected into the tongue of the mouse and were allowed to drain to the cervical lymph nodes while the mouse remained immobilized under anesthesia.
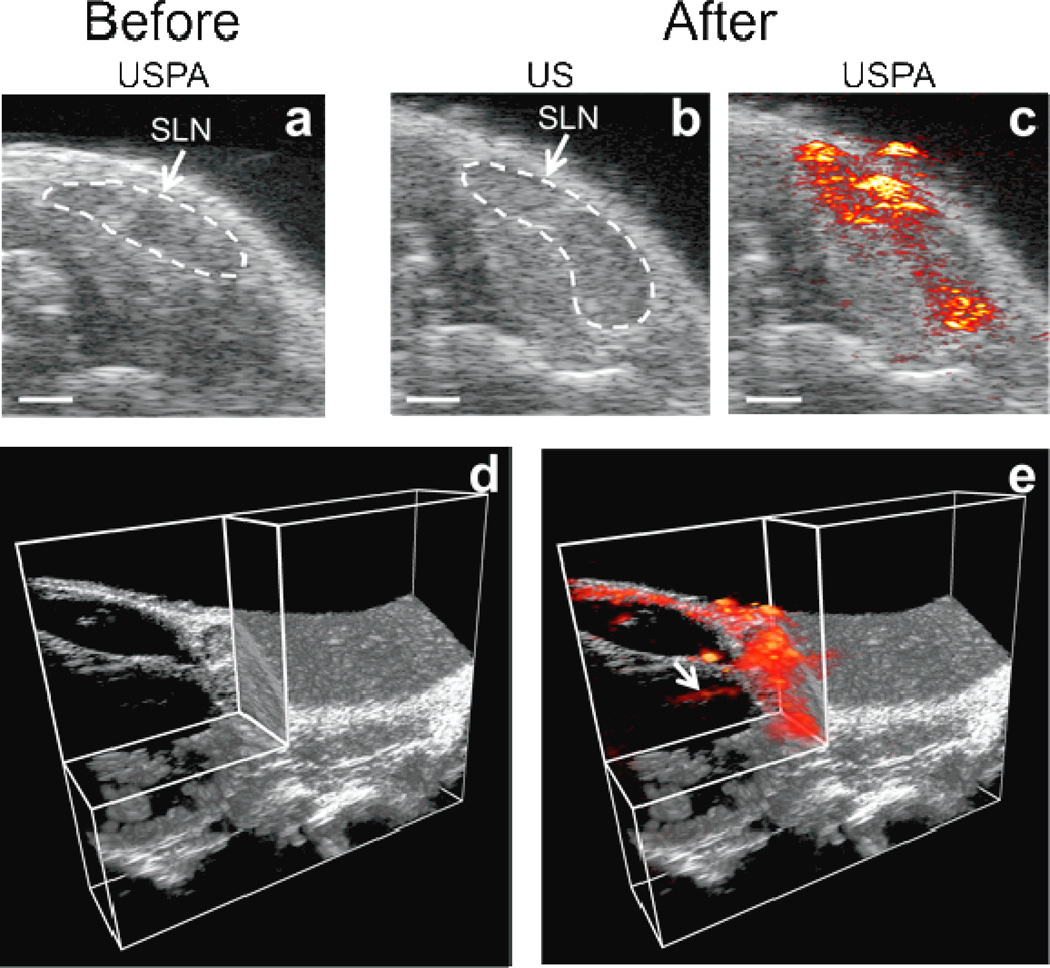
The cervical lymph nodes are easily identified with US imaging as a dark, hypoechoic bean-shaped region (Fig. 4a–b). Thus, US imaging provides an excellent method to guide and provide an anatomical reference for subsequent PA imaging (which provides minimal inherent signal at the chosen optical wavelength and fluence). Photoacoustic images acquired before the injection of Si-AuNPs (Fig. 4a) show that the endogenous PA signal (originating from the blood and skin in the mouse) is very small and not detectable with our imaging system. This is due to the low absorption of these components at 1064 nm and the magnitude of laser fluence used in this imaging experiment (10 mJ/cm2).[31] Because there is no discernible PA signal before the injection of Si-AuNPs, any signal after the injection can be attributed to the nanoparticles. As a result, the Si-AuNPs can be tracked with high specificity. Figure 4c shows overlaid US and PA images 4 hours after the injection of Si-AuNPs. The location of Si-AuNPs is mapped within the SLN, allowing for high contrast identification of the SLN in the USPA image.
Figure 4.
a) Overlaid USPA images of a 2-D slice containing the SLN before the injection of Si-AuNPs. The endogenous PA signal is below the noise floor of the system. b)AUS image 4 hours after the injection of Si-AuNPs with the SLN identified. c) The same US image as in b) with the PA image overlaid shows a strong PA signal throughout the SLN. d) A 3-D US image with a quadrant removed shows the anatomy surrounding the SLN. e) A 3-D PA image acquired 4 hours after the injection of Si-AuNPs overlaid on the US image shows the distribution of Si-AuNPs in the SLN and reveals an afferent lymph vessel (arrow). Scale bars = 1 mm.
By scanning the transducer in the out-of-plane direction, a three-dimensional (3-D) USPA image was acquired (Fig. 4d–e, Supplemental Fig. 1). The 3-D image shows the volumetric distribution of the Si-AuNPs in the SLN as well as a lymphatic vessel feeding into the SLN (Fig. 4e, arrow). Thus, this technology could be used to aid clinicians in identifying and localizing the SLN and visualizing the afferent lymph vessels. The Si-AuNPs resisted major degradation and the signal persisted even after exposure to five hours of pulsed laser light. The strong PA signal indicates that Si-AuNPs are stable in a biological environment and well-suited for in vivo applications.
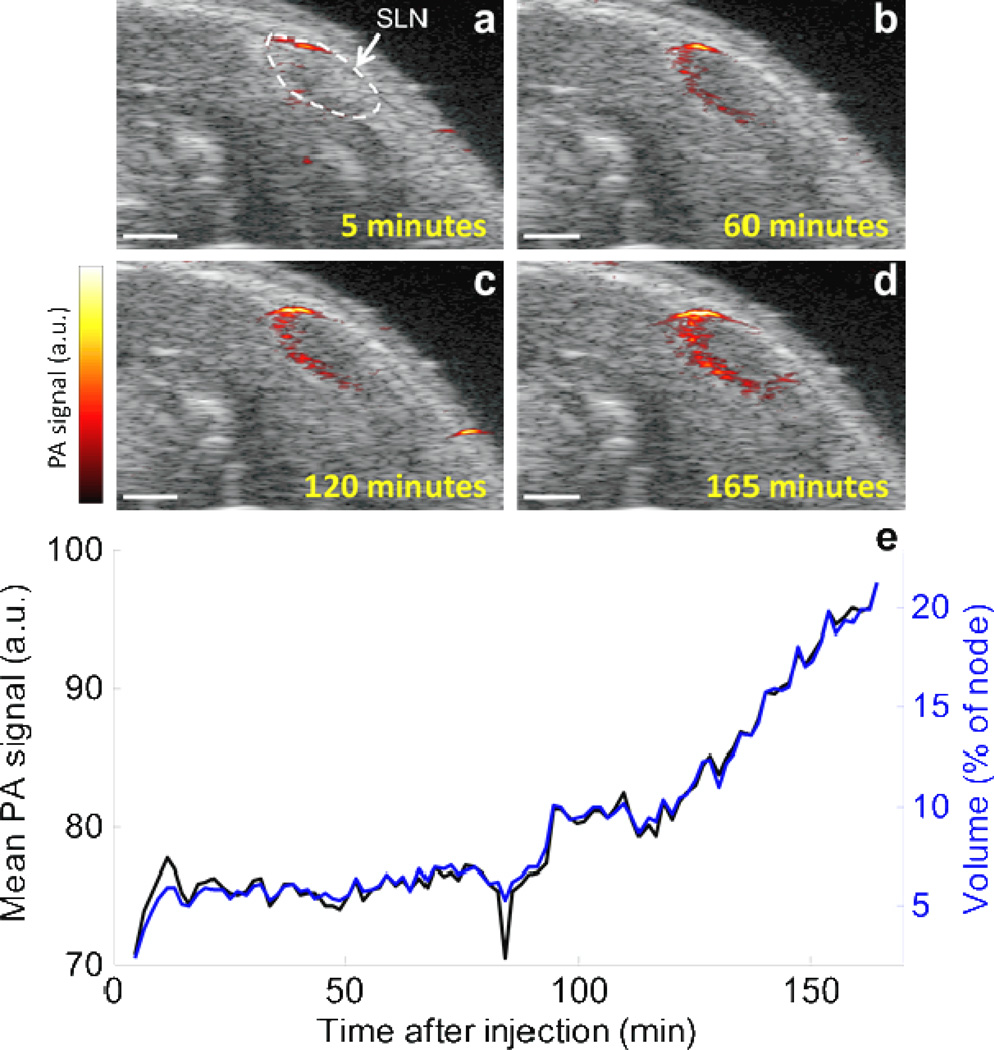
In order to study the drainage kinetics of the Si-AuNPs, we acquired 3-D USPA images of the region surrounding the SLN continuously for 165 minutes following their injection (Supplemental Fig. 2). The results show that the Si-AuNPs are immediately delivered to a localized portion near the top of the SLN, and then they continue to drain to and diffuse one edge of the node (Fig. 5). After 2.5 hours following the injection, the Si-AuNPs are distributed throughout approximately 20% of the SLN. The average PA signal in the SLN was highly correlated with the volume of the node that contained detectable PA signal (Fig. 5e). This suggests that as new Si-AuNPs steadily flowed into the SLN, they also spread throughout the node at a similar rate (i.e., there was no significant “pooling” of the particles). Future work will focus on using the high-resolution images to observe flow patterns and kinetics in normal and metastatic nodes.
Figure 5.
a–d) Combined USPA image of a 2-D slice immediately following the injection of Si-AuNPs. After being quickly delivered to the SLN, the signal slowly spreads throughout the node. e) the average PA signal (black) and volume of the lymph node that contained PA signal above the noise floor (blue) in the SLN increase steadily over the cource of 3 hours after the injection. Scale bars = 1mm.
There are many benefits of tuning the Si-AuNPs to 1064 nm. The endogenous absorption, and thus the background PA signal, at 1064 nm is much lower than other common PA imaging wavelengths (700–900 nm). Indeed, by simply choosing 1064 as the imaging wavelength, a 38% improvement in contrast can be achieved.[31] The low endogenous absorption also removes the need for multi-wavelength imaging and spectral unmixing to accurately differentiate endogenous and exogenous PA signal. In the case of our experiments, the endogenous signal was below the noise level, so the entire PA image can be attributed to Si-AuNPs. The decreased absorption and scattering also allow for higher levels of laser exposure and better penetration in tissue. In fact, the safe level of human skin exposure to a pulsed laser source as determined by the American National Standards Institute is 100 mJ/cm2 (versus 20 mJ/cm2 in the visible range). Thus, Si-AuNPs could be used for imaging at much greater depths than other particles or dyes commonly used for SLN mapping. Finally, inexpensive, high-energy solid state lasers are available at 1064 nm. This provides a cost-effective method for the eventual clinical translation of this technology.
3. Conclusion
We have developed a new contrast agent for PA imaging – Si-AuNPs – and have demonstrated its ability to aid in PA image-guided SLN mapping. The Si-AuNPs have proven to be more stable under laser irradiation than PEGylated AuNPs, making them better suited for sustained PA imaging. In addition, the drainage kinetics of Si-AuNPs through the lymphatic system makes them well-suited to act as a contrast agent for PA image-guided SLN mapping. Furthermore, their long retention in the SLN suggests they may provide an excellent alternative to small-molecule dyes, which quickly drain out of the SLN.
4. Materials and Methods
All chemicals were used as received: chloroauric acid (HAuCl4(aq), Sigma), trisodium citrate (TSC, Sigma), sodium borohydride (NaBH4, Acros), cetyltrimethyl-ammoniumbromide (CTAB, Amresco), ascorbic acid (AA, Alpha Aesar), potassium iodide (KI, Fisher Scientific), sodium hydroxide (NaOH, JT Baker), methyl poly(ethylene glycol) thiol (mPEG-SH, MW 5000, Laysan Bio), isopropanol (IPA, Acros), tetraethyl orthosilicate (TEOS, Aldrich), ammonium hydroxide (NH4OH, Fisher Scientific, 29% in water). Prior to synthesis, all glassware and stir bars were cleaned with aqua regia.
The synthesis of AuNPs was adapted from Ha, et al.[24] To synthesize the gold seeds, 5 mL of HAuCl4 (1 mM) and 5 mL of TSC (1 mM) were added to 10 mL of ultra-filtrated (18 MΩ-cm, Thermo Scientific Barnstead Diamond water purification system) deionized water (DIUF) under vigorous stirring (750 rpm) in a 20 mL glass scintillation vial. Then, 600 µL of ice-cold NaBH4 (100 mM) was quickly added to the solution which resulted in a reddish-orange solution.
The second step involved preparation of the growth solution and the addition of a small quantity of seed solution to the growth solution. The growth solution began with dissolving 396 mL of CTAB (102 mM) at 30 °C in a 500 mL glass beaker under medium stirring (300 rpm). Then 4 mL of HAuCl4 (25 mM) was added, causing the solution to turn yellow-orange. Then 400 µL of KI (10 mM) and 240 µL of NaOH (1 M) were added. Afterwards 8 mL of AA (100 mM) was added, which changed the solution from yellow-orange to colorless. The solution was heated to 35 °C and 1 mL of the seed solution was added.[24] After 15 seconds, the beaker was removed from the hot plate and left undisturbed for 1 hour. The solution slowly changed from transparent to a deep violet over the course of approximately 5 minutes. After one hour, the solution was sealed with Parafilm (Pechiney Plastic Packaging, Inc), placed on a hot plate set to 65 °C, and left overnight to allow for separation of the nanoplates from byproduct nanospheres in the solution. The following day, the solution was carefully aspirated without disturbing the sides and bottom of the glass beaker. The nanoplates, which had adhered to the bottom of the flask, were immediately resuspended in a relatively small volume (~5 mL) of DIUF and briefly sonicated.[25] Because the vast majority of the byproduct spheres had been removed, the resuspended solution exhibited a dark-green color.
PEGylation was performed immediately following resuspension of the particles. An equal volume of nanoplates diluted to a peak optical extinction coefficient of 15 cm−1 and mPEGSH solution (.2 mM) were combined under vigorous stirring (750 rpm), sonicated for thirty seconds, and allowed to react overnight. The particles were then centrifuged at 20,000 rcf for 12 minutes, resuspended in DIUF and then underwent centrifugation filtration (100 kDa Amicon ultra-15, Millipore) at 2,500 rcf for 5 minutes to remove excess mPEG-SH.
Finally, a thin silica layer was added to the AuNPs using a modified Stöber method.[27, 32, 33] Under vigorous stirring (750 rpm), 1.2 mL of TEOS in IPA (3% by volume) and 1.2 mL of 29% NH4OH in IPA (1.4% by volume) were added to 5 mL of nanoplates diluted to have a peak optical extinction coefficient of 6 cm−1. The pH of the solution was measured to be approximately 10.9. The mixture was left to react for 2–5 hours. Longer reaction times led to thicker silica layers. Deposition of silica on the surface of the nanoplates could be confirmed through a shift in the peak extinction wavelength towards the near-infrared. The reaction was halted by combining the solution with an equal volume of DIUF and performing centrifugation filtration (100 kDa Amicon ultra-15, Millipore) at 2,500 rcf for 5 minutes. The resulting Si-AuNPs were resuspended in DIUF or Dulbecco’s phosphate buffer solution (DPBS).
The optical properties of the gold nanoplates were characterized through ultraviolet-visiblenear-infrared (UV-Vis-NIR) spectrophotometry using a UV-VIS-NIR Spectrophotometer (UV-3600, Shimadzu). Morphological properties of the gold nanoplates were observed through transmission electron microscopy (TEM). To prepare the samples, copper-Formvar-carbon TEM grids were submerged in a solution of concentrated gold nanoplates for two minutes and allowed to dry in air. The grids were then imaged using the TEM mode of a Hitachi S-5500 FESEM with a field emission electron source operating at 30 kV.
A human pancreatic cancer cell line, L3.6pl, was incubated with the Si-AuNPs to test for cytotoxicity. The cell line was cultured using Dulbecco's modified eagle medium (DMEM, Sigma) (with 4500 mg glucose/L, L-glutamine, NaHCO3, and pyridoxine HCl) supplemented with 10% fetal bovine serum (FBS, Sigma) and 1% penicillinstreptomycin (Pen/Strep, Invitrogen) while being maintained at 37 °C and 5% CO2 in a humidified incubator. The cells were seeded in a 96 well plate (5000 cells in 100 µL of media). After allowing the cells to grow for 48 hours and attach to the plate, the media was removed and replaced with 100 µL of a combination of Si-AuNPs and media (with a peak optical extinction coefficient of 0, 0.2, 2, or 20 cm−1). The cells were incubated with the Si-AuNPs for 48 hours. The media and Si-AuNPs were removed and 100 µL of fresh media was added. The extinction of each well in the plate was measured at 490 nm using a Synergy HT Multimode Microplate Reader (BioTek). Next, 20 µL of (3-(4,5-dimethylthiazol-2-yl)-5-(3-carboxymethoxyphenyl)-2-(4-sulfophenyl)-2H-tetrazolium) phenazine methosulfate (PMS) from the CellTiter 96 Aqueous Non-Radioactive Cell Proliferation Assay (Promega) was added to each well. After 75 minutes, the extinction at 490 nm was again measured. The increase in extinction was proportional to the number of viable cells in each well. A series of t-tests were used to identify statistically significant deviations in the proliferation with respect to the control wells.
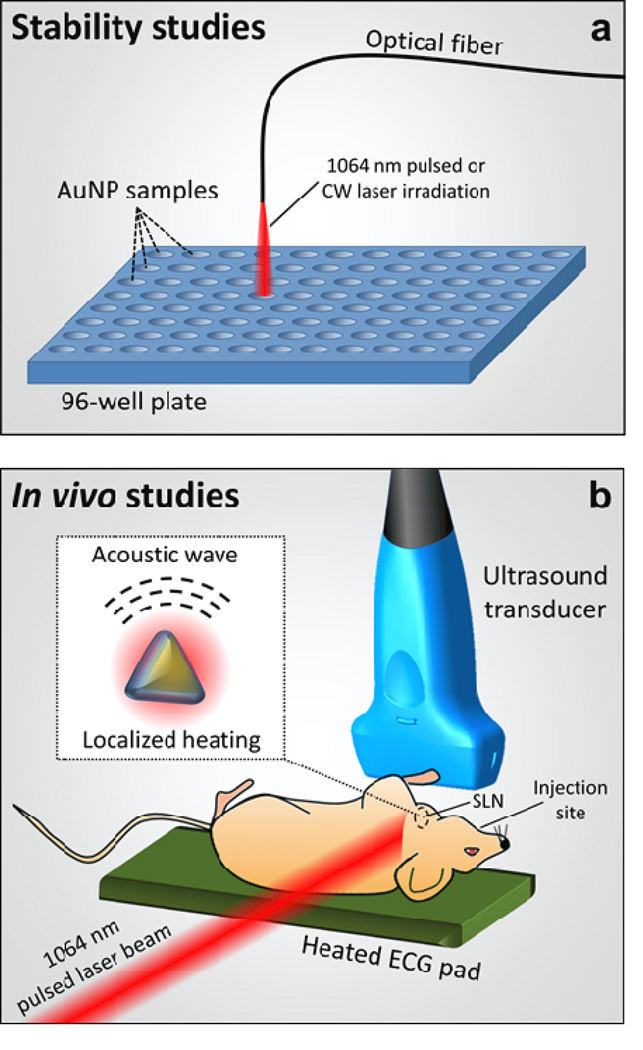
The thermal stability of Si-AuNPs and PEGylated AuNPs was studied through exposure to pulsed and continuous laser irradiation to simulate PA imaging and photothermal therapy (Fig. 6a). Silica coated and uncoated nanoplates were placed in a 96-well plate at a concentration resulting in a peak optical extinction coefficient of 3 cm−1. All trials were completed in triplicate. All of the wells were irradiated with a pulsed nanosecond laser (Quanta-Ray Pro, Spectra Physics) that was coupled to a tunable OPO laser system (Permiscan, GWU) set at 1064 nm with pulse repetition rate of 10 Hz and pulse duration of 5–7 ns. A control of 0 pulses was compared with both 300 and 1000 pulses at a fluence of 10 mJ/cm2. To study the stability of the particles under continuous wave irradiation, a continuous wave diode-pumped solid state laser (Opto Engine) operating at 1064 nm, with a fluence rate of 5 W/cm2 was used. Each well was irradiated for between 0 and 3 minutes. After irradiation, 250 µL were recovered from each well, diluted with DIUF to a final volume of 2.5 mL, and characterized with UV-Vis-NIR spectrophotometry and TEM.
Figure 6.
a) Experimental setup to study the stability of AuNPs and Si-AuNPs, and b) experimental setup for in vivo studies. The pulsed laser induced localized heating near the Si-AuNPs which results in the generation of acoustic waves centered at the Si-AuNPs (b, inset).
All animal studies were approved by the Institutional Animal Care and Use Committee (IACUC) at The University of Texas at Austin. Homozygous Nu/Nu female mice, age 57–70 days were purchased from Charles River Laboratories. The mice were imaged using a Vevo 2100 high frequency ultrasound imaging system (VisualSonics) with an MS-550 40-MHz, 256-element linear array transducer (Fig. 6b). A pulsed nanosecond laser (Quanta-Ray Pro, Spectra Physics) was coupled to a tunable OPO laser system (Permiscan, GWU) to provide the 1064-nm optical source for imaging. A laser fluence of 10 mJ/cm2 was used for all in-vivo imaging. During imaging, the mice were anesthetized with a mixture of isoflurane and oxygen (1.5%). Clear ultrasound gel was used to couple the transducer to the neck of the mouse. USPA images were acquired in a 3-D volume surrounding the cervical lymph nodes. During imaging, the heart rate, respiration rate, and body temperature were monitored.
Following the initial imaging, the mice were injected with 40 µL of sterile Si-AuNPs (peak optical extinction coefficient of 20 cm−1 in PBS) submucosally in the tongue. USPA images were continuously collected in the same 3-D imaging volume immediately following the injection for up to 4 hours. Imaging was performed again at 24 and 48 hours after the Si-AuNP injection. Immediately following the final imaging session, the mice were sacrificed via an isoflurane overdose (5%) and cervical dislocation.
Supplementary Material
Acknowledgements
We thank Katherine Bontrager for her help with the MTS assay and Zachary Criss for his help with the refinement of the Si-AuNP synthesis protocol. This work was supported by the National Institutes of Health under grants F31CA168168, R01EB008101, and R01CA149740.
References
- 1.Veronesi U, Paganelli G, Galimberti V, Viale G, Zurrida S, Bedoni M, et al. Sentinel-node biopsy to avoid axillary dissection in breast cancer with clinically negative lymph-nodes. Lancet. 1997 Jun 28;349(9069) doi: 10.1016/S0140-6736(97)01004-0. [DOI] [PubMed] [Google Scholar]
- 2.Goldberg J, Riedel E, Morrow M, Van Zee K. Morbidity of Sentinel Node Biopsy: Relationship Between Number of Excised Lymph Nodes and Patient Perceptions of Lymphedema. Annals of Surgical Oncology. 2011;18(10) doi: 10.1245/s10434-011-1688-1. [DOI] [PubMed] [Google Scholar]
- 3.Langer I, Guller U, Berclaz G, Koechli OR, Schaer G, Fehr MK, et al. Morbidity of Sentinel Lymph Node Biopsy (SLN) Alone Versus SLN and Completion Axillary Lymph Node Dissection After Breast Cancer Surgery: A Prospective Swiss Multicenter Study on 659 Patients. Annals of Surgery. 2007;245(3) doi: 10.1097/01.sla.0000245472.47748.ec. [DOI] [PMC free article] [PubMed] [Google Scholar]
- 4.Mao YP, Liang SB, Liu LZ, Chen Y, Sun Y, Tang LL, et al. The N staging system in nasopharyngeal carcinoma with radiation therapy oncology group guidelines for lymph node levels based on magnetic resonance imaging. Clinical cancer research. 2008;14(22):7497–7503. doi: 10.1158/1078-0432.CCR-08-0271. [DOI] [PubMed] [Google Scholar]
- 5.Kim S, Lim YT, Soltesz EG, De Grand AM, Lee J, Nakayama A, et al. Near-infrared fluorescent type II quantum dots for sentinel lymph node mapping. Nature biotechnology. 2003;22(1):93–97. doi: 10.1038/nbt920. [DOI] [PMC free article] [PubMed] [Google Scholar]
- 6.Richards PS, Peacock TE. The role of ultrasound in the detection of cervical lymph node metastases in clinically N0 squamous cell carcinoma of the head and neck. Cancer Imaging. 2007;7(1):167–178. doi: 10.1102/1470-7330.2007.0024. PubMed PMID: 18055290. Pubmed Central PMCID: 2151323. [DOI] [PMC free article] [PubMed] [Google Scholar]
- 7.Luke GP, Yeager D, Emelianov SY. Biomedical applications of photoacoustic imaging with exogenous contrast agents. Ann Biomed Eng. 2012 Feb;40(2):422–437. doi: 10.1007/s10439-011-0449-4. PubMed PMID: 22048668. [DOI] [PubMed] [Google Scholar]
- 8.Mallidi S, Larson T, Tam J, Joshi PP, Karpiouk A, Sokolov K, et al. Multiwavelength Photoacoustic Imaging and Plasmon Resonance Coupling of Gold Nanoparticles for Selective Detection of Cancer. Nano Letters. 2009;9(8):2825–2831. doi: 10.1021/nl802929u. [DOI] [PMC free article] [PubMed] [Google Scholar]
- 9.Levi J, Kothapalli SR, Ma T-J, Hartman K, Khuri-Yakub BT, Gambhir SS. Design, Synthesis, and Imaging of an Activatable Photoacoustic Probe. Journal of the American Chemical Society. 2010;132(32):11264–11269. doi: 10.1021/ja104000a. [DOI] [PMC free article] [PubMed] [Google Scholar]
- 10.Zerda Adl, Liu Z, Bodapati S, Teed R, Vaithilingam S, Khuri-Yakub BT, et al. Ultrahigh Sensitivity Carbon Nanotube Agents for Photoacoustic Molecular Imaging in Living Mice. Nano Letters. 2010;10(6):2168–2172. doi: 10.1021/nl100890d. [DOI] [PMC free article] [PubMed] [Google Scholar]
- 11.Kim C, Cho EC, Chen J, Song KH, Au L, Favazza C, et al. In Vivo Molecular Photoacoustic Tomography of Melanomas Targeted by Bioconjugated Gold Nanocages. ACS Nano. 2010;4(8):4559–4564. doi: 10.1021/nn100736c. [DOI] [PMC free article] [PubMed] [Google Scholar]
- 12.Li P-C, Wang C-RC, Shieh D-B, Wei C-W, Liao C-K, Poe C, et al. In vivo photoacoustic molecular imaging with simultaneous multiple selective targeting usingantibody-conjugated gold nanorods. Opt Express. 2008;16(23):18605–18615. doi: 10.1364/oe.16.018605. [DOI] [PubMed] [Google Scholar]
- 13.Xu M, Lihong VW. Photoacoustic imaging in biomedicine. Review of Scientific Instruments. 2006;77(4):041101. [Google Scholar]
- 14.Beard P. Biomedical photoacoustic imaging. Interface Focus. 2011 Aug 6;1(4):602–631. doi: 10.1098/rsfs.2011.0028. 2011. [DOI] [PMC free article] [PubMed] [Google Scholar]
- 15.Song KH, Kim C, Cobley CM, Xia Y, Wang LV. Near-Infrared Gold Nanocages as a New Class of Tracers for Photoacoustic Sentinel Lymph Node Mapping on a Rat Model. Nano Letters. 2008;9(1):183–188. doi: 10.1021/nl802746w. [DOI] [PMC free article] [PubMed] [Google Scholar]
- 16.Song KH, Kim C, Maslov K, Wang LV. Noninvasive in vivo spectroscopic nanorod-contrast photoacoustic mapping of sentinel lymph nodes. European Journal of Radiology. 2009;70(2):227–231. doi: 10.1016/j.ejrad.2009.01.045. [DOI] [PMC free article] [PubMed] [Google Scholar]
- 17.Hu M, Chen J, Li Z-Y, Au L, Hartland GV, Li X, et al. Gold nanostructures: engineering their plasmonic properties for biomedical applications. Chemical Society Reviews. 2006;35(11):1084–1094. doi: 10.1039/b517615h. [DOI] [PubMed] [Google Scholar]
- 18.Kumar S, Aaron J, Sokolov K. Directional conjugation of antibodies to nanoparticles for synthesis of multiplexed optical contrast agents with both delivery and targeting moieties. Nature Protocols. 2008;3(2):314–320. doi: 10.1038/nprot.2008.1. PubMed PMID: WOS: 000254137000018. English. [DOI] [PubMed] [Google Scholar]
- 19.Jain PK, Lee KS, El-Sayed IH, El-Sayed MA. Calculated Absorption and Scattering Properties of Gold Nanoparticles of Different Size, Shape, and Composition: Applications in Biological Imaging and Biomedicine. The Journal of Physical Chemistry B. 2006;110(14):7238–7248. doi: 10.1021/jp057170o. 2011/10/02. [DOI] [PubMed] [Google Scholar]
- 20.Kim S, Chen Y-S, Luke GP, Emelianov SY. In vivo three-dimensional spectroscopic photoacoustic imaging for monitoring nanoparticle delivery. Biomed Opt Express. 2011;2(9):2540–2550. doi: 10.1364/BOE.2.002540. [DOI] [PMC free article] [PubMed] [Google Scholar]
- 21.Homan KA, Souza M, Truby R, Luke GP, Green C, Vreeland E, et al. Silver Nanoplate Contrast Agents for in Vivo Molecular Photoacoustic Imaging. ACS Nano. 2012;6(1):641–650. doi: 10.1021/nn204100n. 2012/07/27. [DOI] [PMC free article] [PubMed] [Google Scholar]
- 22.Bao C, Beziere N, del Pino P, Pelaz B, Estrada G, Tian F, et al. Gold Nanoprisms as Optoacoustic Signal Nanoamplifiers for in Vivo Bioimaging of Gastrointestinal Cancers. Small. 2012 doi: 10.1002/smll.201201779. [DOI] [PubMed] [Google Scholar]
- 23.Cai X, Li W, Kim CH, Yuan Y, Wang LV, Xia Y. In vivo quantitative evaluation of the transport kinetics of gold nanocages in a lymphatic system by noninvasive photoacoustic tomography. ACS Nano. 2011 Dec 27;;5(12):9658–9667. doi: 10.1021/nn203124x. PubMed PMID: 22054348. Pubmed Central PMCID: 3246549. [DOI] [PMC free article] [PubMed] [Google Scholar]
- 24.Ha TH, Koo H-J, Chung BH. Shape-Controlled Syntheses of Gold Nanoprisms and Nanorods Influenced by Specific Adsorption of Halide Ions. The Journal of Physical Chemistry C. 2006;111(3):1123–1130. 2012/08/27. [Google Scholar]
- 25.Ha TH, Kim YJ, Park SH. Complete separation of triangular gold nanoplates through selective precipitation under CTAB micelles in aqueous solution. Chemical Communications. 2010;46(18):3164–3166. doi: 10.1039/c001574a. [DOI] [PubMed] [Google Scholar]
- 26.Chang SS, Shih CW, Chen CD, Lai WC, Wang CRC. The shape transition of gold nanorods. Langmuir. 1999 Feb 2;15(3):701–709. PubMed PMID: WOS:000078488300009. English. [Google Scholar]
- 27.Chen YS, Frey W, Kim S, Homan K, Kruizinga P, Sokolov K, et al. Enhanced thermal stability of silica-coated gold nanorods for photoacoustic imaging and image-guided therapy. Opt Express. 2010 Apr 26;18(9):8867–8878. doi: 10.1364/OE.18.008867. PubMed PMID: 20588732. Pubmed Central PMCID: 3404861. [DOI] [PMC free article] [PubMed] [Google Scholar]
- 28.Chen Y-S, Frey W, Aglyamov S, Emelianov S. Environment-Dependent Generation of Photoacoustic Waves from Plasmonic Nanoparticles. Small. 2012;8(1):47–52. doi: 10.1002/smll.201101140. [DOI] [PMC free article] [PubMed] [Google Scholar]
- 29.Chen Y-S, Frey W, Kim S, Kruizinga P, Homan K, Emelianov S. Silica-coated gold nanorods as photoacoustic signal nanoamplifiers. Nano letters. 2011;11(2):348–354. doi: 10.1021/nl1042006. [DOI] [PMC free article] [PubMed] [Google Scholar]
- 30.Myers JN, Holsinger FC, Jasser SA, Bekele BN, Fidler IJ. An Orthotopic Nude Mouse Model of Oral Tongue Squamous Cell Carcinoma. Clinical Cancer Research. 2002 Jan 1;8(1):293–298. 2002. [PubMed] [Google Scholar]
- 31.Homan K, Kim S, Chen YS, Wang B, Mallidi S, Emelianov S. Prospects of molecular photoacoustic imaging at 1064 nm wavelength. Opt Lett. 2010 Aug 1;35(15):2663–5. doi: 10.1364/OL.35.002663. PubMed PMID: 20680092. Epub 2010/08/04. eng. [DOI] [PMC free article] [PubMed] [Google Scholar]
- 32.Lu Y, Yin Y, Mayers BT, Xia Y. Modifying the Surface Properties of Superparamagnetic Iron Oxide Nanoparticles through A Sol,àíGel Approach. Nano Letters. 2002;2(3):183–186. 2002/03/01. [Google Scholar]
- 33.Stöber W, Fink A, Bohn E. Controlled growth of monodisperse silica spheres in the micron size range. Journal of Colloid and Interface Science. 1968;26(1):62–69. [Google Scholar]
Associated Data
This section collects any data citations, data availability statements, or supplementary materials included in this article.


