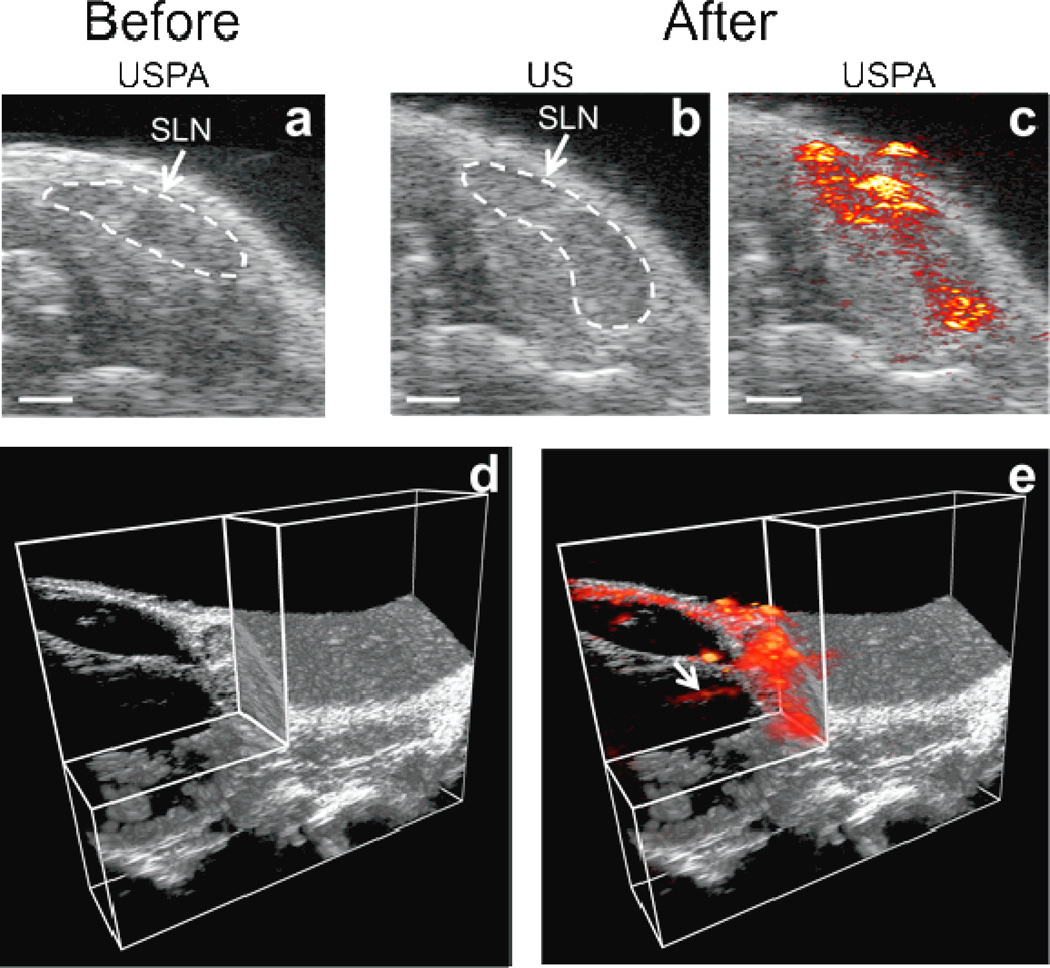
Figure 4.
a) Overlaid USPA images of a 2-D slice containing the SLN before the injection of Si-AuNPs. The endogenous PA signal is below the noise floor of the system. b)AUS image 4 hours after the injection of Si-AuNPs with the SLN identified. c) The same US image as in b) with the PA image overlaid shows a strong PA signal throughout the SLN. d) A 3-D US image with a quadrant removed shows the anatomy surrounding the SLN. e) A 3-D PA image acquired 4 hours after the injection of Si-AuNPs overlaid on the US image shows the distribution of Si-AuNPs in the SLN and reveals an afferent lymph vessel (arrow). Scale bars = 1 mm.

