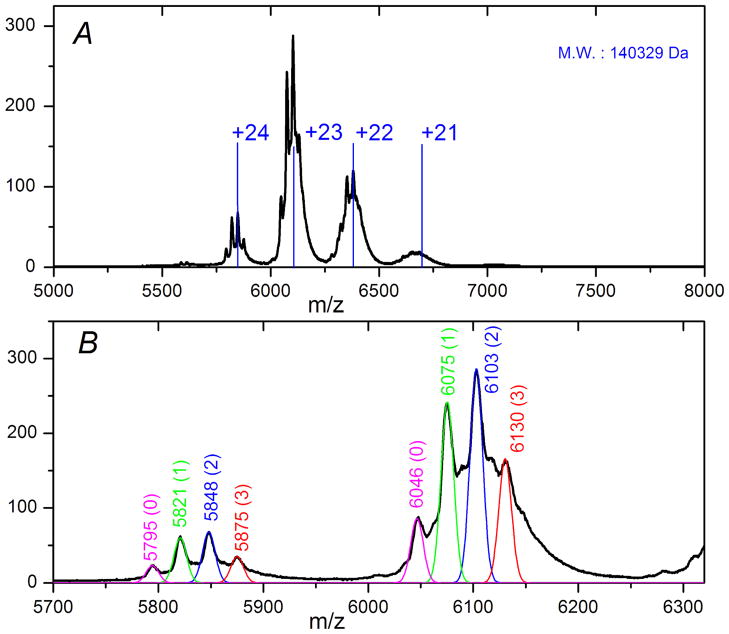
Figure 2.
(A) Mass spectrum of intact AFMO complex by native electrospray mass spectrometry. Nano-ESI conditions: voltage of ISCID: 180 V; CID: 20 eV. The vertical blue lines are theoretical m/z values for charge states +20 to +24 generated using the labeled MW; the +23 charge state was assigned to the base peak. (B) Gaussian functions with bandwidth of m/z = 6 were used to simulate the various resolved peaks (+22 and +23) of ions with molecular weights of 139,043 Da (pink), 139,685 Da (green), 140,329 Da (blue), and 140,976 Da (red).

