Abstract
Immobilized trypsin produces very fast protein digestion, which is attractive for application to high throughput bottom-up proteomics. While there is a rich literature on the preparation of immobilized trypsin, there are very few studies that investigate its application to complex proteomic samples. In this work, we compared solution-phase trypsin with trypsin immobilized on magnetic microspheres for digestion of two complex proteomes, E. coli and the MCF7 cell line. The digests were separated by HPLC, and detected with a Q-Exactive mass spectrometer, which generated high resolution and high quality parent- and fragment-ion mass spectra. The data were analyzed using MaxQuant. We make several conclusions about the features of immobilized trypsin digestion of complex proteomes. First, both immobilized and solution-phase trypsin generate peptides that sample the same protein pool. Second, immobilized trypsin can digest complex proteomes two orders of magnitude faster than solution-phase trypsin while retaining similar numbers of protein identifications and proteome depth. Digestion using immobilized trypsin for 5-min produces a similar number of missed cleavages as solution-based trypsin digestion for 4-hr; digestion using immobilized trypsin for 20-min produces a similar number of missed cleavages as solution-based trypsin digestion for 12-hr. Third, immobilized trypsin produces quantitatively reproducible digestion of complex proteomes. Finally, there is small but measureable loss of peptide due to non-specific adsorption to the immobilization matrix. This adsorption generates a bias against detection of basic peptides.
Keywords: Immobilized trypsin, complex proteome, bottom-up proteomics, high resolution mass spectrometry, reproducibility
1.0 Introduction
Bottom-up proteomics is widely used for characterization of complex protein samples [1, 2]. In this approach, proteins are first digested to peptides with enzymes, typically trypsin, followed by peptide separation by HPLC, analysis with tandem mass spectrometry (MS/MS), and identification via database searching [3, 4].
The throughput of bottom-up proteomics has undergone significant improvements over the past two decades. In a recent impressive example, close to 4 000 yeast proteins were identified using a single 4-h reversed phase liquid chromatography-electrospray ionization (ESI)-MS/MS run [5]. Sample preparation has now become the rate-limiting step in proteomic research. Current protocols typically require at least 24 hours. Tryptic digestion is usually the most time-consuming step in sample preparation; digestion performed with solution-phase trypsin often requires 12 hours or longer. Bottom-up proteomics throughput will benefit from faster protein digestion.
Unlike digestion with solution-phase trypsin, immobilized trypsin provides efficient protein digestion within minutes. Fast digestion is most likely due to the much higher trypsin concentration of immobilized enzyme compared with solution-phase trypsin [6]. Immobilization also dramatically reduces autoproteolysis of the enzyme compared to solution-phase digestion, which is important when analyzing small samples. Various materials have been used for trypsin immobilization, including monolithic materials [7–18], magnetic nano/micro-particles [19–27], and others [28–34].
Despite significant efforts to optimize immobilization chemistry, immobilized trypsin has had very little impact in routine proteomic research. Most publications on trypsin immobilization have focused on the development of novel immobilization matrices and protocols. Inevitably, the immobilized enzyme is evaluated using no more than a few hundred proteins. Only few reports have applied immobilized trypsin for relatively large-scale proteome profiling or quantitation [30, 31, 33]. Those reports do not compare digestion using solution-phase and immobilized trypsin. In this work, we compare solution-phase trypsin with trypsin immobilized on magnetic microspheres [24] for the digestion of both the E. coli and the MCF7 cell line proteomes. We found that immobilized trypsin produces similar proteome data, digestion completeness, and digestion reproducibility as solution-phase trypsin but with two orders of magnitude shorter digestion time.
2.0 Experimental section
2.1 Materials and reagents
Bovine pancreas TPCK-treated trypsin, urea, ammonium bicarbonate (NH4HCO3), dithiothreitol (DTT), iodoacetamide (IAA), N-hydroxysulfosuccinimide sodium salt (NHS), N-(3-dimethylaminopropyl)-N′-ethylcarbodiimide hydrochloride (EDC), 2-morpholinoethanesulfonic acid monohydrate (MES monohydrate), benzamidine, and ethanolamine were purchased from Sigma–Aldrich (St. Louis, MO, USA). Acetonitrile (ACN) and formic acid (FA) were purchased from Fisher Scientific (Pittsburgh, PA, USA). Water was deionized by a Nano Pure system from Thermo Scientific (Marietta, OH, USA).
Carboxyl functionalized magnetic microspheres (BioMag®Plus carboxyl, mean diameter ~1.5 μm, surface titration, ~240 μmol/g) were purchased from Bangs Laboratories, Inc. (Fishers, IN, USA). ZipTips C18 (ZTC18S096) were purchased from Millipore (Bedford, MA, USA). C18 spin columns were purchased from Pierce Biotechnology (Rockford, IL, USA).
Eagle’s minimal essential medium (EMEM), fetal bovine serum (FBS), GlutaMAX™ (100×), insulin, and Antibiotic-Antimycotic (Anti-Anti, 100×) were purchased from Life Technologies Corporation (Grand Island, NY, USA). Mammalian Cell-PE LB™ Buffer used for cell lysis was purchased from G-Biosciences (St. Louis, MO, USA). Complete, mini protease inhibitor cocktail (provided in EASYpacks) was purchased from Roche (Indianapolis, IN, USA).
2.2 Preparation of magnetic microspheres based immobilized trypsin
The detailed process for the trypsin immobilization is the same as reference [24]. In brief, the carboxyl functionalized magnetic microspheres were activated with NHS and EDC to generate succinimide groups on the magnetic microsphere surface, and followed by trypsin immobilization on the surface via reaction between the succinimide group on the microsphere surface and an amine group on trypsin. The immobilized trypsin magnetic microspheres were suspended in 20 mM NH4HCO3 (pH ~8.0), and stored at 4 °C.
2.3 E. coli cell lysate sample preparation
E. coli (Dh5-Alpha) was cultured with the same protocol as reference [36]. After culture and centrifugation, E. coli pellets were washed three times with PBS. Then, the pellets were suspended in 8 M urea and 100 mM Tris-HCl (pH 8.0) buffer containing protease inhibitor and sonicated for 15 min on ice for cell lysis. The lysate was centrifuged at 18 000g for 15 min, and the supernatant was collected, followed by protein concentration measurement with the BCA method [37]. An aliquot of protein (900 μg) was precipitated overnight in acetone at 20 °C. After centrifugation, the protein pellet was washed again with cold acetone. The pellet was warmed to room temperature for several minutes to allow evaporation of the acetone. The E. coli proteins were dissolved in 300 μL of 8 M urea in 100 mM NH4HCO3 (pH ~8.0), followed by protein denaturation at 37 °C for 60 min, reduction with DTT (8 mM) at 60 °C for 1 h, and alkylation with IAA (20 mM) at room temperature for 30-min in the dark. Next, 1.2 mL of 100 mM NH4HCO3 (pH ~8.0) was added to dilute the urea concentration to < 2 M. The protein concentration was 0.6 mg/mL. The sample was stored at 80 °C.
The experimental design for the E. coli sample digestion is shown in Figure 1A. For solution-phase trypsin digestion, 50 μL of the 0.6 mg/mL E. coli protein solution was placed in a new Eppendorf tube. For digestion, 1 μg of trypsin was added into the sample for 12 h at 37 °C. The same amount of protein sample was also digested for 4 h at 37 °C with 1 μg trypsin. The digests were acidified with FA to terminate the reaction, followed by Ziptip C18 desalting. The desalted peptides were lyophilized and redissolved in 0.1% FA to produce a 1 mg/mL peptide solution, which was used for ultra-performance liquid chromatography (UPLC)-ESI-MS/MS analysis.
Figure 1.
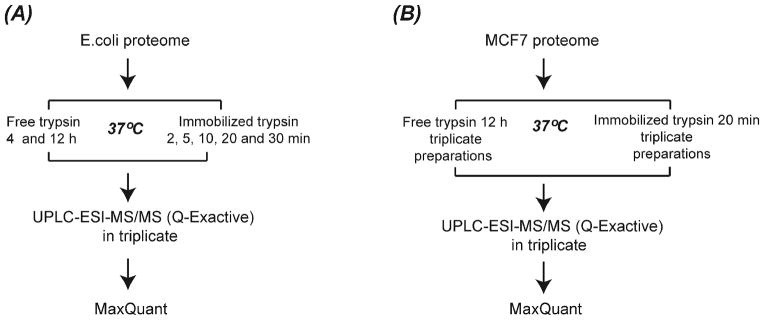
Experimental design for E. coli proteome (A) and MCF7 cell line proteome (B) analysis.
For digestion using immobilized trypsin, 20 μL of the 0.6 mg/mL E. coli protein sample was added to an Eppendorf tube with 300 μg of immobilized trypsin magnetic microspheres. The solution was briefly vortexed to disperse the microspheres in the tube. The sample was then immediately transferred to a 37 °C water bath with occasional vortexing. Five different digestion times were employed: 2-, 5-, 10-, 20-, and 30-min (Figure 1A). After digestion, the magnetic microspheres were separated from the solution with a magnet, and the supernatant was transferred to a new Eppendorf tube. To reduce peptide loss due to interaction with microspheres, we washed the magnetic microspheres twice with 30 μL of 40% (v/v) ACN containing 0.1% (v/v) FA, and the washings were combined with the digest to generate the E. coli digest. Then, the digests were lyophilized and redissolved in 20 μL of 0.1% (v/v) FA, followed by ZipTip C18 desalting. The solutions were lyophilized again, and then were dissolved in 0.1% (v/v) FA to generate 1 mg/mL peptide solutions for further UPLC-ESI-MS/MS analysis.
2.4 MCF7 cell lysate sample preparation
MCF7 cells were cultured in a T150 flask at 37 °C and 5% CO2 in EMEM containing 10% FBS, 10 μg/mL insulin, GlutaMAX™ (1×) and Anti-Anti (1×). The cell pellet was washed three times with PBS, and then suspended in 1.5 mL of mammalian cell-PE LB™ buffer containing protease inhibitor for cell lysis. The cells were lysed by sonication for 10 min on ice, and kept on ice for an additional 10 min. The lysate was then centrifuged at 15 000 g for 10 min, and the supernatant was collected for protein concentration measurement with the BCA method. An aliquot of MCF 7 cell lysate containing 690 μg of proteins was precipitated in acetone at -20 °C overnight. After centrifugation, the protein pellet was washed again with cold acetone to remove contaminates. Then, the protein pellet was kept at room temperature in the hood for several minutes to allow the acetone to evaporate.
The 690 μg protein aliquot was dissolved in 170 μL of 8 M urea and 100 mM NH4HCO3 (pH ~8.0), and incubated at 37 °C for 1 h for protein denaturation. Then, 8 μL of 1 M DTT in 100 mM NH4HCO3 (pH ~8.0) was added into the protein solution, and incubated at 37 °C for 1.5 h for protein reduction. For protein alkylation, 20 μL of 1 M IAA in 100 mM NH4HCO3 (pH ~8.0) was added and kept at room temperature in the dark for 30 min. Next, 520 μL of 100 mM NH4HCO3 (pH ~8.0) was added to the protein solution to dilute the urea concentration below 2 M. Finally, the protein solution was stored at −80 °C.
The experimental design for the MCF7 cell lysate digestion is shown in Figure 1B. For solution-phase trypsin digestion, three aliquots of 30 μL of protein solution (~ 30 μg proteins) were put into separate Eppendorf tubes. Then, 1 μg trypsin was added into each tube, and incubated at 37 °C for 12 h. The digests in each tube were acidified with FA to terminate the reaction, and desalted with C18 spin column, followed by lyophilization. The peptides in each tube were redissolved in 20 μL of 2% ACN and 0.1% FA for UPLC-ESI-MS/MS analysis.
For immobilized trypsin digestion, three aliquots of 30 μL of protein solution (~ 30 μg proteins) were put into separate Eppendorf tubes containing 500 μg of immobilized trypsin magnetic microspheres. The tubes were briefly vortexed and then transferred to a 37 °C water bath for 20-min tryptic digestion with occasional vortexing. The other operations are the same as E. coli protein digestion mentioned above with minor modifications. First, 50 μL of 40% (v/v) ACN containing 0.1% (v/v) FA was used to wash the magnetic microspheres. Second, the lyophilized digests were redissolved in 60 μL of 2% ACN and 0.1% FA, followed by peptide desalting with a C18 spin column. Third, the digests in each Eppendorf tube were dissolved in 20 μL of 2% ACN and 0.1% FA for UPLC-ESI-MS/MS analysis.
2.5 UPLC-ESI-MS/MS analysis
A nanoACQUITY UltraPerformance LC® (UPLC®) system (Waters, Milford, MA, USA) was used for separation of the digests. Buffer A (0.1% FA in water) and buffer B (0.1% FA in ACN) were used as mobile phases for gradient separation. Protein digests were automatically loaded onto a commercial C18 reversed phase column (Waters, 100 μm×100 mm, 1.7 μm particle, BEH130C18, column temperature 40 °C) with 2% buffer B for 10 min at a flow rate of 1.0 μL/min, followed by 3-step gradient separation, 2 min from 2 % B to 8% B, 138 min to 28% B, 5 min to 85% B, and maintained for 10 min. The column was equilibrated for 14 min with 2% buffer B prior to the next sample analysis. The eluted peptides from the C18 column were pumped through a metal-coated emitter for electrospray ionization, and detection with a Q-Exactive mass spectrometer (Thermo Fisher Scientific). The ion transfer tube temperature was 280 °C. The S-Lens RF level was set to 50.0. For E. coli digest analysis, 0.5 μL of sample was loaded for each run; for MCF7 7 cell lysate digest analysis, 2.5 μL of sample was loaded for each run. Each sample was analyzed in triplicate.
The MS method was programmed in a data dependent acquisition (DDA) mode based on reference [38] with minor modifications. A top 12 method was used. Full MS scans were acquired in the Orbitrap mass analyzer over the m/z 350–1800 range (for E. coli digests) and over the m/z 380–1800 (for MCF 7 cell lysate digests) with resolution as 70,000 (m/z 200) and target value of 1.00E+06. The twelve most intense peaks with charge state ≥ 2 were isolated in the quadrupole with isolation window of 2.0 m/z, and further fragmented in the higher energy collisional dissociation (HCD) cell with normalized collision energy of 30% (for E. coli digests) and 28% (for MCF7 digests). The tandem mass spectrum was acquired in the Orbitrap mass analyzer with resolution of 35,000 (m/z 200) and target value of 1.00E+06. The ion selection threshold was 5.0E+04 counts (for E. coli digests) and 2.5E+04 counts (for MCF7 digests), and the maximum allowed ion accumulation times were 250 ms for full MS scans and 120 ms for tandem mass spectrum. The microscans were set as 1 for both MS and MS/MS. Peptide match and exclude isotopes were set on. For all the experiments, dynamic exclusion was set to 30 s.
2.6 Data Analysis
Raw MS files were analyzed by MaxQuant [39] version 1.3.0.5. MS/MS spectra were searched by the Andromeda search engine [40]. The NCBI-E. coli (DH1) database containing forward and reverse sequences (8 320 entries including forward and reverse sequences) was used for E. coli data analysis. The UniProt-human database containing forward and reverse sequences (totally 179 256 sequences) was used for MCF7 data analysis. The databases also included common contaminants. MaxQuant analysis included an initial search with a precursor mass tolerance of 20 ppm, main search precursor mass tolerance of 6 ppm, and fragment mass tolerance of 20 ppm. The search included enzyme as trypsin, variable modifications of methionine oxidation, N-terminal acetylation and deamidation (NQ), and fixed modification of carbamidomethyl cysteine. Minimum peptide length was set to seven amino acids and the maximum number of missed cleavages was set to four (for E. coli data) and two (for MCF7 cell line data). The false discovery rate (FDR) was set to 0.01 for both peptide and protein identifications. The proteins identified by the same set of peptides were grouped and reported as one protein group. The “match between runs” function was turned on, and the time window was set as 2 min. The protein and peptide tables were filtered to remove the identifications from the reverse database and common contaminants.
The MaxQuant results were imported into Perseus software [41] (version 1.4.0.20) for further analysis. For calculations of peptide pI and grand average of hydropathy (GRAVY) values, Compute pI/Mw tool (http://web.expasy.org/compute_pi/), and GRAVY CALCULATOR (http://www.gravy-calculator.de/) were employed.
3.0 Results and discussion
3.1 Proteome digestion throughput and depth
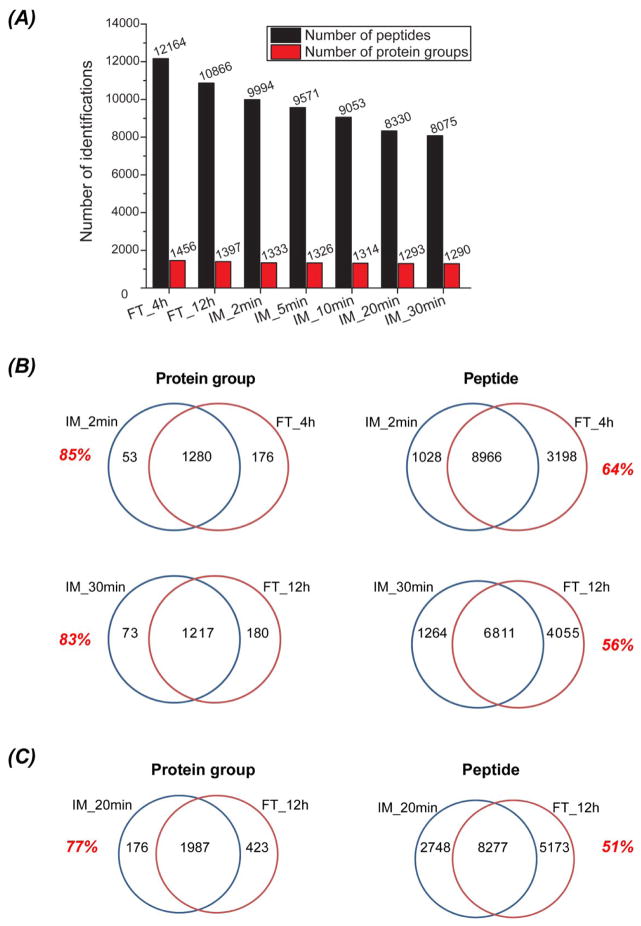
We first evaluated digestion depth. With 4- and 12-h solution-phase trypsin digestion, around 1 400 E. coli proteins were identified; with 2- to 30-min immobilized trypsin digestion, around 1 300 E. coli proteins were consistently identified, Figure 2A. These results demonstrate that a 2-min digestion using immobilized trypsin produces roughly the same number of peptide and protein identifications as solution-phase trypsin digestion for 4-h (240-min); immobilized trypsin reduces digestion time by two orders of magnitude compared to solution-phase trypsin for the E. coli proteome with essentially no penalty in the number of protein identifications.
Figure 2.
Number of protein and peptide identifications from immobilized trypsin (IM, 2-to 30-min) and solution-phase trypsin (FT, 4- and 12-h) digestion of E. coli proteome (A), and overlap of proteins and peptides from IM and FT digestion of E. coli proteome (B) and MCF7 proteome (C).
For the MCF7 proteome, 20-min digestion with immobilized trypsin was compared with 12-h digestion using solution-phase trypsin. As with the E. coli experiment, a comparable number of protein identifications were obtained (2 163 vs. 2 410). We note that immobilized trypsin consistently generated slightly fewer peptide identifications compared with solution-phase trypsin. In addition, longer digestion times consistently resulted in slightly fewer peptide and protein identifications for both immobilized trypsin and solution-phase trypsin. These phenomena are discussed below.
We then used the protein intensity from MaxQuant database searching results to determine the E. coli and MCF7 proteome dynamic ranges, S-Figure 1 in supporting material. For E. coli data (S-Figure 1A), immobilized trypsin for 2 min and solution-phase trypsin for 4 h both yielded five orders of magnitude proteome dynamic range. MCF7 (S-Figure 1B), both immobilized trypsin (20-min) and solution-phase trypsin (12-h) generated close to 5.5 orders of magnitude proteome dynamic range, which demonstrates that immobilized trypsin and solution-phase trypsin produce identical proteome depth.
We also determined the identification overlaps between immobilized trypsin and solution-phase trypsin for both the E. coli and MCF7 proteome digests, Figure 2B and C. The protein identification overlaps ranged from 77% to 85%, and the peptide overlaps ranged from 51% to 64%. We performed duplicate UPLC-ESI-MS/MS analyses of an E. coli digest, and the protein and peptide identification overlaps were ~85% and ~75%, respectively. An earlier study from this group demonstrated a 70% overlap in peptide and an 80% overlap in protein IDs for duplicate UPLC-ESI-MS/MS analyses of a RAW264.7 cell line digest generated with solution-phase trypsin for 12 hr [42]. These results suggest that there is not a significant difference in the pool of identified proteins using these two digestion methods. In contrast, the two methods appear to sample a different pool of peptides; the overlap in peptide IDs between the two methods is lower than the overlap in peptide IDs from duplicate analyses of the same digest.
3.2 Proteome digestion completeness
We further evaluated the digestion completeness using both immobilized trypsin and solution-phase trypsin for the E. coli and MCF7 proteomes. Three parameters were considered: number of missed cleavages, peptide length (number of amino acids), and hydrophobicity of the generated peptides.
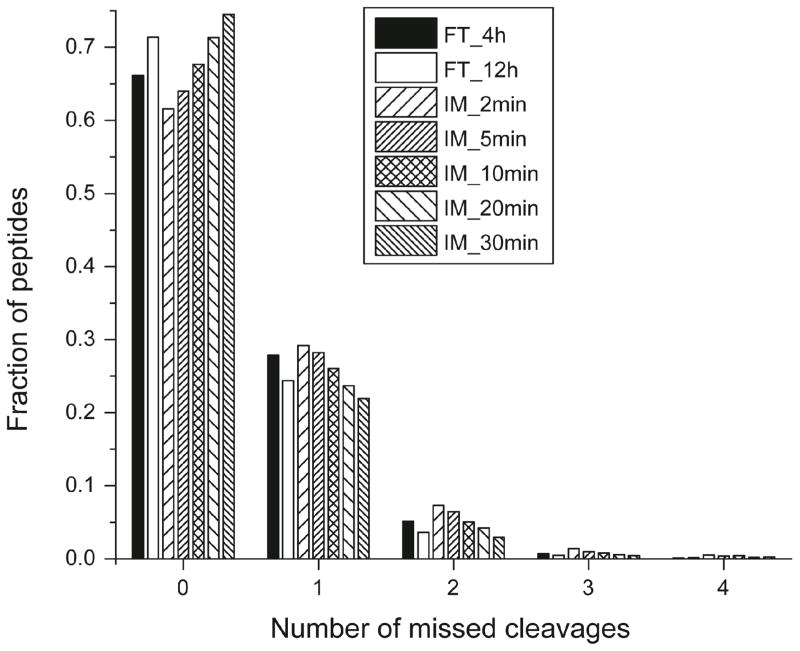
The number of missed cleavages shows the same trend for immobilized trypsin (2- to 30-min) and solution-phase trypsin (4- and 12-h) digestion of E. coli, Figure 3. As expected, longer digestion time yields more complete digestion, generating a higher fraction of peptides with no missed cleavages, and a correspondingly lower fraction with 1–4 missed cleavages. Digestion with immobilized trypsin for 5-min generates a similar number of missed cleavages as solution-phase trypsin digestion for 4-h. Immobilized trypsin digestion for 20-min and solution-phase trypsin digestion for12-h also produced a similar number of missed cleavages. As noted above, immobilized trypsin and solution-phase trypsin generate slightly different pools of peptides, resulting in relatively low overlap at the peptide level, Figure 2B and C. The missed cleavages information from the MCF7 proteome also suggests a similar difference, S-Figure 2 in supporting material.
Figure 3.
Distributions of number of missed cleavages for identified peptides from immobilized trypsin (IM, 2- to 30-min) and solution-phase trypsin (FT, 4- and 12-h) digestion of E. coli proteome.
A 12-h solution-phase trypsin digestion tends to generate slightly shorter peptides compared with a 4-h solution-phase trypsin digestion for E. coli (S-Figure 3A); in contrast, immobilized trypsin with 2- and 5-min digestion produced similar fragment length distributions, as did immobilized trypsin with 10-, 20-, and 30-min digestion times for E. coli (S-Figure 3B–C). The 4-hr solution-phase trypsin digestion generated similar peptide length distributions as 2- and 5-min immobilized trypsin digestion for E. coli (S-Figure 3B). Finally, a 12-hr digestion with solution-phase trypsin generated similar peptide length distribution as a 20-min digestion with immobilized trypsin (S-Figure 4).
As expected, longer digestion times produce shorter peptides for both immobilized trypsin and solution-phase trypsin. This decrease in fragment length is due to fewer missed cleavages, and likely contributes to the slight decrease of identifications with longer digestion time presented in Figure 2A, because the information from small peptides tends to be lost during acquisition of mass spectra and data analysis. In addition, longer digestion times can result in the generation of non-tryptic peptides from any chymotrypsin impurity.
We also analyzed the hydrophobicity of the peptides generated by immobilized trypsin and solution-phase trypsin digestion. The GRAVY value was used to estimate peptide hydrophobicity, where positive values correspond to hydrophobic peptides and negative values correspond to hydrophilic peptides. Because the surfaces of proteins in aqueous solution tend to be hydrophilic and interior parts tend to be hydrophobic, the hydrophobicity information of peptides can reflect the digestion depth of proteins. Solution-phase trypsin digestion of E. coli proteome for 4- and 12-h yields the same GRAVY value distribution (S-Figure 5), indicating a similar depth of protein digestion. A 5-min immobilized trypsin digestion and a 4-h solution-phase trypsin digestion of E. coli sample produce the same GRAVY value distributions, and a 2-min immobilized trypsin digestion tends to generate more hydrophilic peptides compared with a 5-min immobilized trypsin digestion (S-Figure 6A). In addition, the GRAVY value distributions from 5- to 30-min immobilized trypsin digestions are virtually identical (S-Figure 6B). The MCF7 peptides also show identical GRAVY distribution for the two digestion methods (S-Figure 7).
We draw two conclusions from these data. First, a 5-min digestion with immobilized trypsin generates the same digestion depth as a 4-h (and 12-h) digestion with solution-phase trypsin. Second, a 5-min digestion with immobilized trypsin generates the same number of missed cleavages and peptide length as a 4-h digestion with solution-phase trypsin.
3.3 Proteome digestion reproducibility
Protein digestion reproducibility is important for quantitative proteomics. To evaluate digestion reproducibility, we performed triplicate digestions of the MCF7 cell line proteome using immobilized trypsin for 20-min and solution-phase trypsin for 12-h. The number of protein identifications was used to estimate the qualitative reproducibility. Label-free quantitation (LFQ) intensities [43] from MaxQuant database searching results were employed to check the quantitative reproducibility.
The number of protein identifications from triplicate preparations of the MCF7 proteome with immobilized trypsin (20min) and solution-phase trypsin (12h) is quite reproducible with relative standard deviations of 1.2% and 3.5%, respectively. The protein identification overlaps of duplicate preparations with immobilized and solution-phase trypsin are both at the 80% level. These results demonstrate that immobilized trypsin and solution-phase trypsin have comparable qualitative reproducibility for complex proteome digestion.
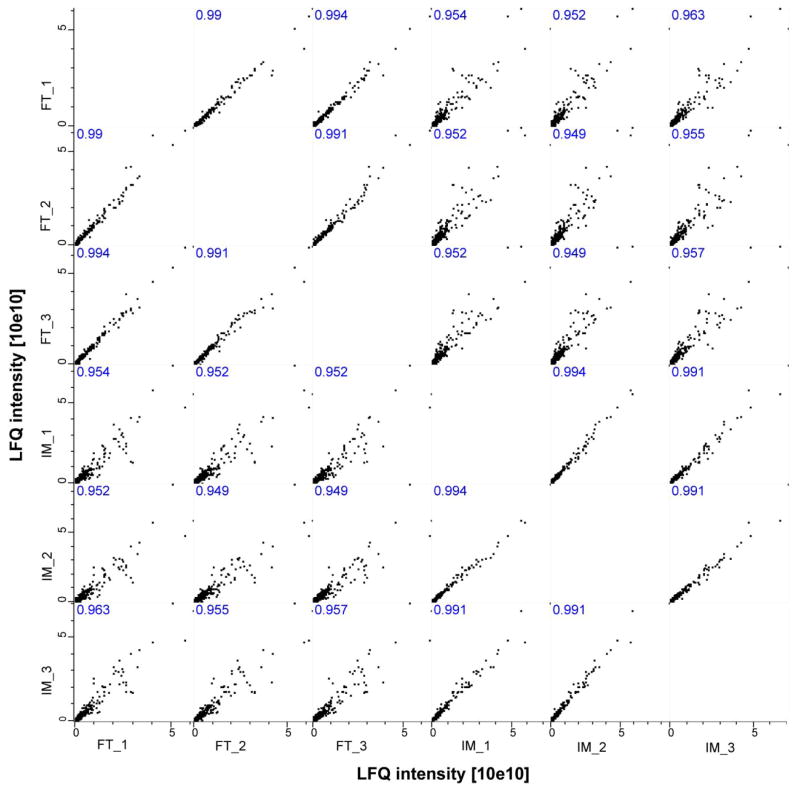
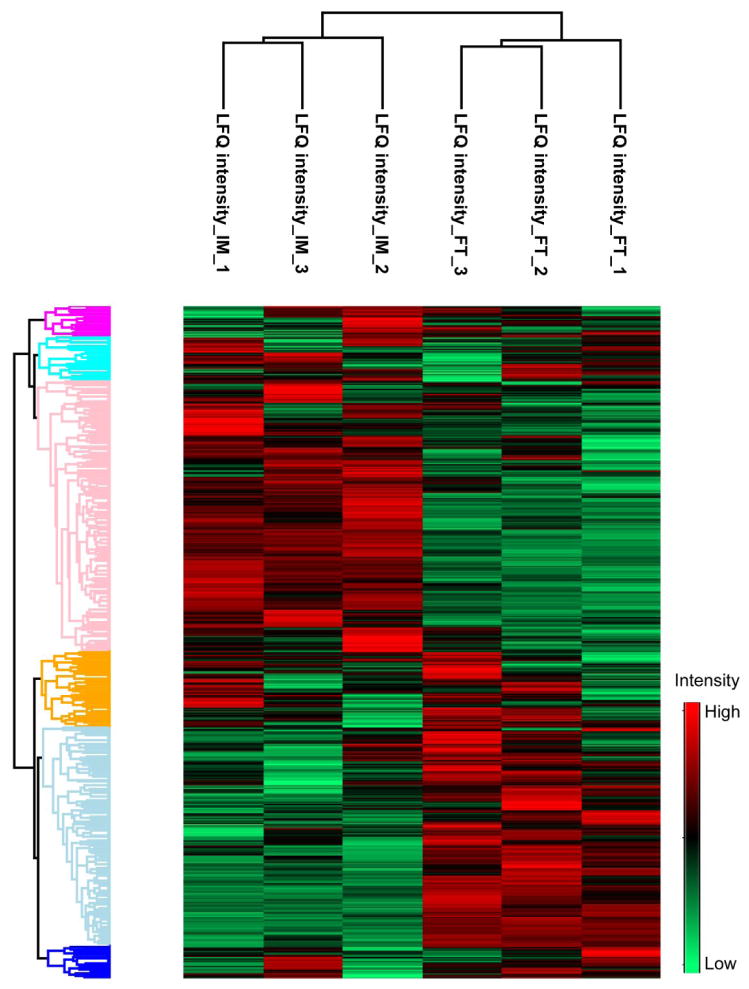
More importantly, the digestion of both immobilized trypsin and solution-phase trypsin are quantitatively reproducible in terms of LFQ intensity, Figure 4. The correlation of LFQ intensity between duplicate preparations with both immobilized trypsin (IM) and solution-phase trypsin (FT) is good (r ≥ 0.99), indicating that the immobilized trypsin digestion is quantitatively reproducible. Interestingly, the correlation of LFQ intensity between IM and FT is lower (r close to 0.95), which suggests that there may be a modest LFQ intensity difference between IM and FT. The results also agree with a cluster analysis based on the LFQ intensity from triplicate preparations of IM and FT, Figure 5. Triplicate preparations of IM and FT were clustered together, and IM and FT were separated into two clusters, which also indicate that quantitative reproducibility of immobilized trypsin digestion is good and suitable for large-scale proteome quantitation applications.
Figure 4.
Multi-scatter correlations of label free quantitation (LFQ) intensity from triplicate preparations of MCF7 cell line proteome with immobilized trypsin (IM, 20-min) and solution-phase trypsin (FT, 12-h) digestion. Perseus software [39] (version 1.4.0.20) was used to generate the correlations, and Pearson correlation (r) values were labelled.
Figure 5.
Cluster analysis results of MCF7 cell line proteome data based on label free quantitation (LFQ) intensity from triplicate preparations with immobilized trypsin (IM, 20-min) and solution-phase trypsin (FT, 12-h) digestion. Perseus software [39] (version 1.4.0.20) was used to generate the cluster analysis results. In order to obtain the cluster analysis results, Z-score was applied for normalization, and proteins with valid values from at least four conditions were used for the cluster analysis.
3.4 Peptide loss
We pointed out in section 3.1 that immobilized trypsin generated fewer peptide identifications than solution-phase trypsin, Figure 2A. We return to this topic.
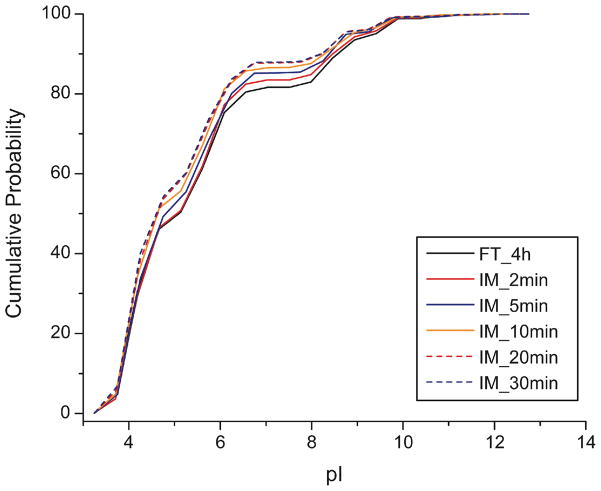
The straightforward explanation for the decreased number of peptide identifications is due to interaction of peptides with the magnetic microspheres. Because of the residual carboxyl groups on the microspheres after trypsin immobilization, the surface of microspheres has negative charge in basic buffer (pH 8.0), which might lead to the loss of basic peptides due to ionic interaction. In order to confirm this point, we analyzed the pI distribution of identified peptides from IM and FT digestion of E. coli proteome, Figure 6. Consistent with this explanation, the immobilized trypsin digestion tends to generate more acidic peptides compared with solution-phase trypsin (4h) digestion, which suggests the loss of basic peptides during digestion. We further analyzed the pI distribution of peptides uniquely identified by FT digestion (4 h) and IM digestion (5 min), and the distributions agree well with that shown in Figure 6.
Figure 6.
Isoelectric point (pI) distributions of identified peptides from solution-phase trypsin (FT, 4-h) and immobilized trypsin (IM, 2- to 30-min) digestion of the E. coli proteome.
Interestingly, when the digestion time increases from 2- to 30-min for immobilized trypsin, the loss of basic peptides is more evident. There are two potential explanations for this phenomenon. First, longer digestion time tends to decrease the number of missed cleavages; peptides with missed cleavages will contain additional lysine and arginine residues, which are more basic. To check this explanation, we compared the pI distributions of peptides produced by solution-phase trypsin 4- and 12-h digestion (S-Figure 8). The pI of the identified peptides is quite similar, which suggests that missed cleavages are not the main contribution to the phenomenon.
Second, the loss of basic peptides due to the ionic interaction with microspheres should be time dependent. The outer layer of the trypsin-immobilized magnetic microspheres consists of trypsin molecules (MW 23 kDa; pI ~10.0); the residual carboxyl groups (pKa ~2.0) form the inner layer. When immobilized trypsin digestion is performed at pH 8.0, basic peptides (usually 1 000–2 000 Da) must diffuse through the slightly-positively charged trypsin molecular layer to reach the carboxyl groups, and this process should be time-dependent, as shown in Figure 6.
We also compared the pI distributions of peptides from immobilized trypsin (20-min) and solution-phase trypsin (12-h) digestion of the MCF7 cell line proteome (S-Figure 9). Immobilized trypsin tends to identify more acidic peptides compared with solution-phase trypsin, which is consistent with the E. coli data presented in Figure 6.
It is worth noting that we washed the trypsin-immobilized magnetic microspheres with a 40% (v/v) ACN and 0.1% (v/v) FA solution twice after digestion to recover the potentially lost peptides. However, the data show that this washing protocol is not sufficient to recover the basic peptides. In future work, we will focus on improving recovery of the lost basic peptides.
Finally, we note that the loss of peptide during IM digestion should depends on the matrix used for immobilization. If the IM matrix does not have a negative charge during digestion, the loss of basic peptides could be negligible. The optimal matrix for IM should be hydrophilic and neutral. In addition, the time required for protein digestion with IM depends on the concentration of trypsin immobilized on the matrix. Higher trypsin concentration will produce shorter digestion time.
4.0 Conclusions
We compared solution-phase trypsin with trypsin immobilized on magnetic microspheres for digestion of both the E. coli and the MCF7 proteomes. The resulting digests were analyzed using high-resolution tandem mass spectrometry to characterize the peptides produced in the digests. Immobilized trypsin has two orders of magnitude higher digestion throughput than solution-phase trypsin while retaining similar proteome depth and numbers of protein identifications. The protein pools identified by the two digestion methods show no significant differences. A 5-min digestion with immobilized trypsin produces a similar number of missed cleavages as a 4-hr digestion with solution-phase trypsin; a 20- or 30-min digestion with immobilized trypsin generates a similar number of missed cleavages as a 12-h solution-phase digestion. Immobilized trypsin digestion is quantitatively reproducible for complex proteome digestion. However, some basic peptides can be lost due to interaction with the immobilization matrix.
Supplementary Material
Highlights.
Immobilized trypsin was employed for digestion of complex proteomes.
HPLC coupled with a Q-Exactive mass spectrometer analyzed the digests.
Immobilized trypsin produces 100 times faster digestion than solution-phase trypsin.
Immobilized and solution-phase trypsin yield the same number of proteins and missed cleavages.
Immobilized trypsin digestion is quantitatively reproducible for a complex proteome.
Acknowledgments
We thank Dr. William Boggess of the Notre Dame Mass Spectrometry and Proteomics Facility for his help. This project was supported by a grant from the National Institutes of Health (Grant R01GM096767).
Footnotes
Publisher's Disclaimer: This is a PDF file of an unedited manuscript that has been accepted for publication. As a service to our customers we are providing this early version of the manuscript. The manuscript will undergo copyediting, typesetting, and review of the resulting proof before it is published in its final citable form. Please note that during the production process errors may be discovered which could affect the content, and all legal disclaimers that apply to the journal pertain.
References
- 1.Mann M, Kulak NA, Nagaraj N, Cox J. Mol Cell. 2013;49:583. doi: 10.1016/j.molcel.2013.01.029. [DOI] [PubMed] [Google Scholar]
- 2.Zhang Y, Fonslow BR, Shan B, Baek MC, Yates JR., III Chem Rev. 2013;113:2343. doi: 10.1021/cr3003533. [DOI] [PMC free article] [PubMed] [Google Scholar]
- 3.Gygi SP, Rist B, Gerber SA, Turecek F, Gelb MH, Aebersold R. Nat Biotechnol. 1999;17:994. doi: 10.1038/13690. [DOI] [PubMed] [Google Scholar]
- 4.Chait BT. Science. 2006;314:65. doi: 10.1126/science.1133987. [DOI] [PubMed] [Google Scholar]
- 5.Nagaraj N, Kulak NA, Cox J, Neuhauser N, Mayr K, Hoerning O, Vorm O, Mann M. Mol Cell Proteomics. 2012;11:M111.013722. doi: 10.1074/mcp.M111.013722. [DOI] [PMC free article] [PubMed] [Google Scholar]
- 6.Ma JF, Zhang LH, Liang Z, Shan YC, Zhang YK. Trends Anal Chem. 2011;30:691. [Google Scholar]
- 7.Peterson DS, Rohr T, Svec F, Fréchet JMJ. J Proteome Res. 2002;1:563. doi: 10.1021/pr0255452. [DOI] [PubMed] [Google Scholar]
- 8.Dulay MT, Baca QJ, Zare RN. Anal Chem. 2005;77:4604. doi: 10.1021/ac0504767. [DOI] [PubMed] [Google Scholar]
- 9.Ye ML, Hu S, Schoenherr RM, Dovichi NJ. Electrophoresis. 2004;25:1319. doi: 10.1002/elps.200305841. [DOI] [PubMed] [Google Scholar]
- 10.Palm AK, Novotny MV. Rapid Commun Mass Spectrom. 2004;18:1374. doi: 10.1002/rcm.1500. [DOI] [PubMed] [Google Scholar]
- 11.Duan JC, Sun LL, Liang Z, Zhang J, Wang H, Zhang LH, Zhang WB, Zhang YK. J Chromatogr A. 2006;1106:165. doi: 10.1016/j.chroma.2005.11.102. [DOI] [PubMed] [Google Scholar]
- 12.Ma JF, Liang Z, Qiao XQ, Deng QL, Tao DY, Zhang LH, Zhang YK. Anal Chem. 2008;80:2949. doi: 10.1021/ac702343a. [DOI] [PubMed] [Google Scholar]
- 13.Sun LL, Ma JF, Qiao XQ, Liang Y, Zhu GJ, Shan YC, Liang Z, Zhang LH, Zhang YK. Anal Chem. 2010;82:2574. doi: 10.1021/ac902835p. [DOI] [PubMed] [Google Scholar]
- 14.Liang Y, Tao DY, Ma JF, Sun LL, Liang Z, Zhang LH, Zhang YK. J Chromatogr A. 2011;1218:2898. doi: 10.1016/j.chroma.2011.02.073. [DOI] [PubMed] [Google Scholar]
- 15.Feng S, Ye ML, Jiang XG, Jin WH, Zou HF. J Proteome Res. 2006;5:422. doi: 10.1021/pr0502727. [DOI] [PubMed] [Google Scholar]
- 16.Schoenherr RM, Ye M, Vannatta M, Dovichi NJ. Anal Chem. 2007;79:2230. doi: 10.1021/ac061638h. [DOI] [PMC free article] [PubMed] [Google Scholar]
- 17.Nicoli R, Rudaz S, Stella C, Veuthey JL. J Chromatogr A. 2009;1216:2695. doi: 10.1016/j.chroma.2008.10.046. [DOI] [PubMed] [Google Scholar]
- 18.Sun L, Zhu G, Dovichi NJ. Anal Chem. 2013;85:4187. doi: 10.1021/ac400523x. [DOI] [PMC free article] [PubMed] [Google Scholar]
- 19.Li Y, Xu XQ, Deng CH, Yang PY, Zhang XM. J Proteome Res. 2007;6:3849. doi: 10.1021/pr070132s. [DOI] [PubMed] [Google Scholar]
- 20.Liu JY, Lin S, Qi DW, Deng CH, Yang PY, Zhang XM. J Chromatogr A. 2007;1176:169. doi: 10.1016/j.chroma.2007.10.094. [DOI] [PubMed] [Google Scholar]
- 21.Lin S, Yao GP, Qi DW, Li Y, Deng CH, Yang PY, Zhang XM. Anal Chem. 2008;80:3655. doi: 10.1021/ac800023r. [DOI] [PubMed] [Google Scholar]
- 22.Chen WY, Chen YC. Anal Chem. 2007;79:2394. doi: 10.1021/ac0614893. [DOI] [PubMed] [Google Scholar]
- 23.Li YH, Wojcik R, Dovichi NJ. J Chromatogr A. 2011;1218:2007. doi: 10.1016/j.chroma.2010.10.013. [DOI] [PMC free article] [PubMed] [Google Scholar]
- 24.Sun L, Li Y, Yang P, Zhu G, Dovichi NJ. J Chromatogr A. 2012;1220:68. doi: 10.1016/j.chroma.2011.11.050. [DOI] [PMC free article] [PubMed] [Google Scholar]
- 25.Sun L, Zhu G, Li Y, Yang P, Dovichi NJ. Anal Chem. 2012;84:8715. doi: 10.1021/ac3019608. [DOI] [PMC free article] [PubMed] [Google Scholar]
- 26.Qin W, Song Z, Fan C, Zhang W, Cai Y, Zhang Y, Qian X. Anal Chem. 2012;84:3138. doi: 10.1021/ac2029216. [DOI] [PubMed] [Google Scholar]
- 27.Jiang B, Yang K, Zhao Q, Wu Q, Liang Z, Zhang L, Peng X, Zhang Y. J Chromatogr A. 2012;1254:8. doi: 10.1016/j.chroma.2012.07.030. [DOI] [PubMed] [Google Scholar]
- 28.Yuan H, Zhang L, Hou C, Zhu G, Tao D, Liang Z, Zhang Y. Anal Chem. 2009;81:8708. doi: 10.1021/ac900310y. [DOI] [PubMed] [Google Scholar]
- 29.Klammer AA, MacCoss MJ. J Proteome Res. 2006;5:695. doi: 10.1021/pr050315j. [DOI] [PMC free article] [PubMed] [Google Scholar]
- 30.Masuda T, Saito N, Tomita M, Ishihama Y. Mol Cell Proteomics. 2009;8:2770. doi: 10.1074/mcp.M900240-MCP200. [DOI] [PMC free article] [PubMed] [Google Scholar]
- 31.López-Ferrer D, Hixson KK, Smallwood H, Squier TC, Petritis K, Smith RD. Anal Chem. 2009;81:6272. doi: 10.1021/ac802540s. [DOI] [PMC free article] [PubMed] [Google Scholar]
- 32.Kim HY, Pilosof D, Dyckes DF, Vestal ML. J Am Chem Soc. 1984;106:7304. [Google Scholar]
- 33.Yuan H, Zhou Y, Xia S, Zhang L, Zhang X, Wu Q, Liang Z, Zhang Y. Anal Chem. 2012;84:5124. doi: 10.1021/ac3006796. [DOI] [PubMed] [Google Scholar]
- 34.Bonneil E, Mercier M, Waldron KC. Anal Chim Acta. 2000;404:29. [Google Scholar]
- 35.Ghafourifar G, Fleitz A, Waldron KC. Electrophoresis. 2013;34:1804. doi: 10.1002/elps.201200663. [DOI] [PubMed] [Google Scholar]
- 36.Zhu G, Sun L, Yan X, Dovichi NJ. Anal Chem. 2013;85:2569. doi: 10.1021/ac303750g. [DOI] [PMC free article] [PubMed] [Google Scholar]
- 37.Smith PK, Krohn RI, Hermanson GT, Mallia AK, Gartner FH, Provenzano MD, Fujimoto EK, Goeke NM, Olson BJ, Klenk DC. Anal Biochem. 1985;150:76. doi: 10.1016/0003-2697(85)90442-7. [DOI] [PubMed] [Google Scholar]
- 38.Kelstrup CD, Young C, Lavallee R, Nielsen ML, Olsen JV. J Proteome Res. 2012;11:3487. doi: 10.1021/pr3000249. [DOI] [PubMed] [Google Scholar]
- 39.Cox J, Mann M. Nat Biotechnol. 2008;26:1367. doi: 10.1038/nbt.1511. [DOI] [PubMed] [Google Scholar]
- 40.Cox J, Neuhauser N, Michalski A, Scheltema RA, Olsen JV, Mann M. J Proteome Res. 2011;10:1794. doi: 10.1021/pr101065j. [DOI] [PubMed] [Google Scholar]
- 41.Cox J, Mann M. BMC Bioinformatics. 2012;13:S12. doi: 10.1186/1471-2105-13-S16-S12. [DOI] [PMC free article] [PubMed] [Google Scholar]
- 42.Sun L, Zhu G, Dovichi NJ. Rapid Commun Mass Spectrom. 2013;27:157. doi: 10.1002/rcm.6437. [DOI] [PMC free article] [PubMed] [Google Scholar]
- 43.Luber CA, Cox J, Lauterbach H, Fancke B, Selbach M, Tschopp J, Akira S, Wiegand M, Hochrein H, O’Keeffe M, Mann M. Immunity. 2010;32:279. doi: 10.1016/j.immuni.2010.01.013. [DOI] [PubMed] [Google Scholar]
Associated Data
This section collects any data citations, data availability statements, or supplementary materials included in this article.


