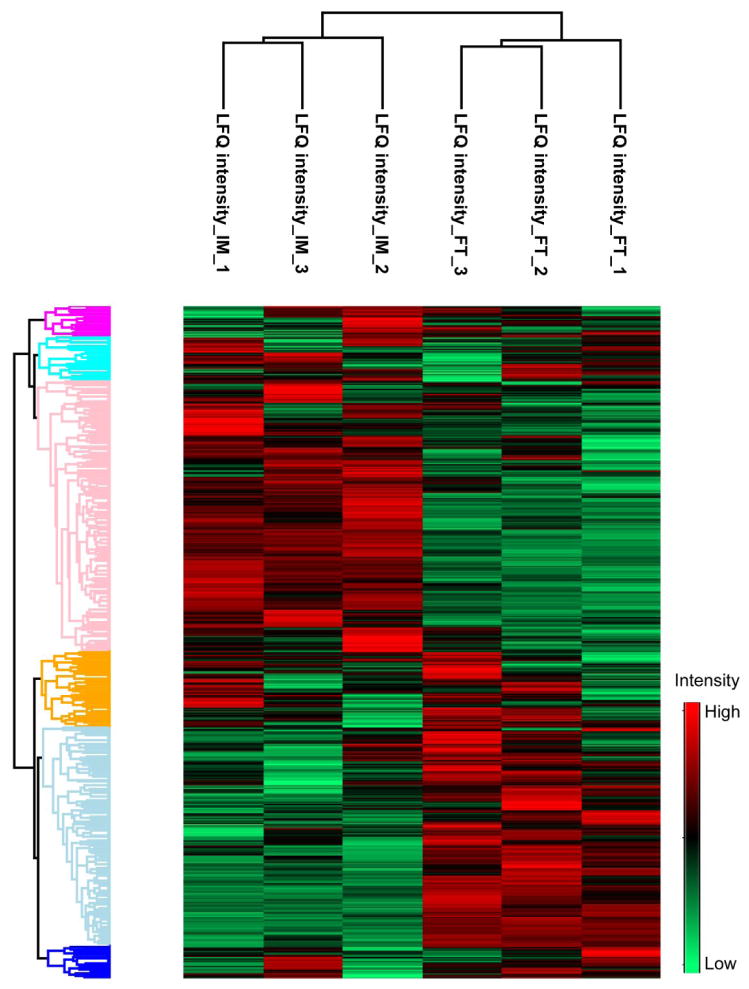
Figure 5.
Cluster analysis results of MCF7 cell line proteome data based on label free quantitation (LFQ) intensity from triplicate preparations with immobilized trypsin (IM, 20-min) and solution-phase trypsin (FT, 12-h) digestion. Perseus software [39] (version 1.4.0.20) was used to generate the cluster analysis results. In order to obtain the cluster analysis results, Z-score was applied for normalization, and proteins with valid values from at least four conditions were used for the cluster analysis.

