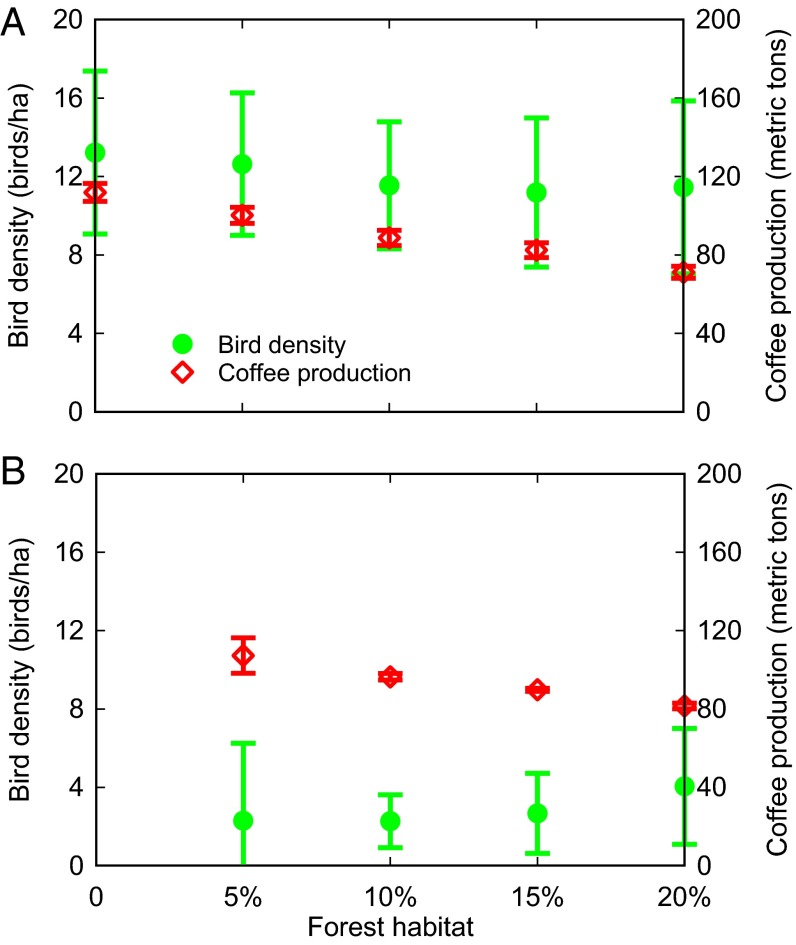
Fig. 2.
Simulated responses of bird density (left axis) and total production of uninfested coffee (right axis) to area of forest habitat (as percentage of total area) with 20% of nonforest area as trees habitat (A) and with no trees habitat (B). Error bars represent 1 SD in results from 512 model runs with low and high values of nine uncertain parameters.

