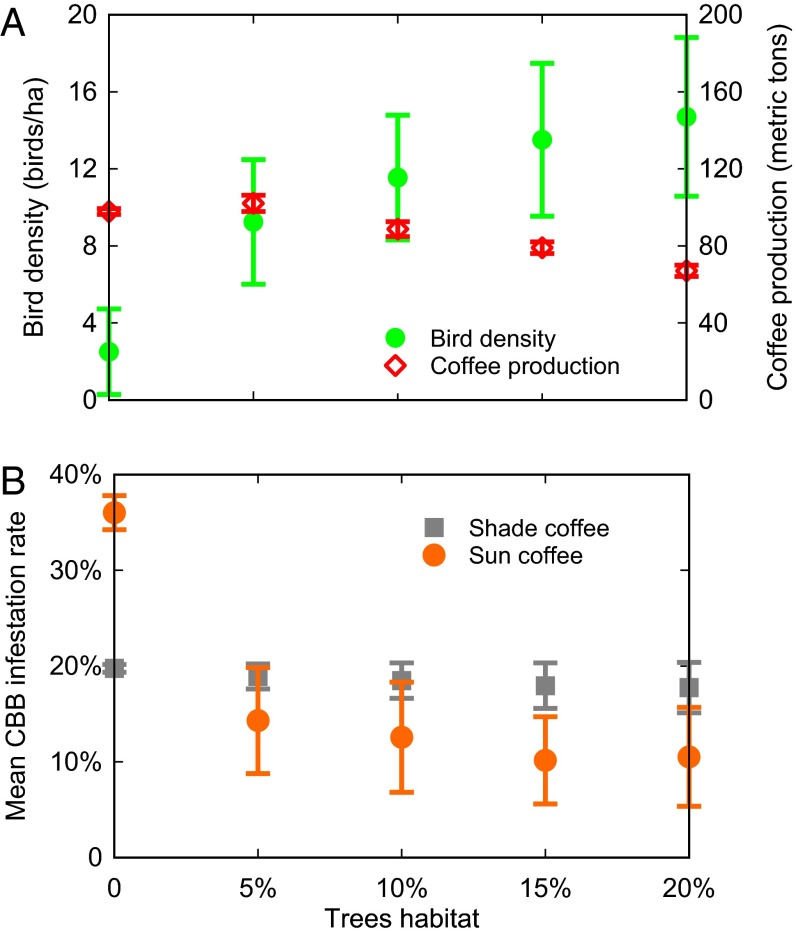
Fig. 3.
Simulated responses to variation to area of trees habitat (as percentage of nonforest habitat). (A) Response of bird density and total uninfested coffee production. (B) Response of CBB infestation rates in shade coffee and sun coffee. Error bars are as in Fig. 2.

