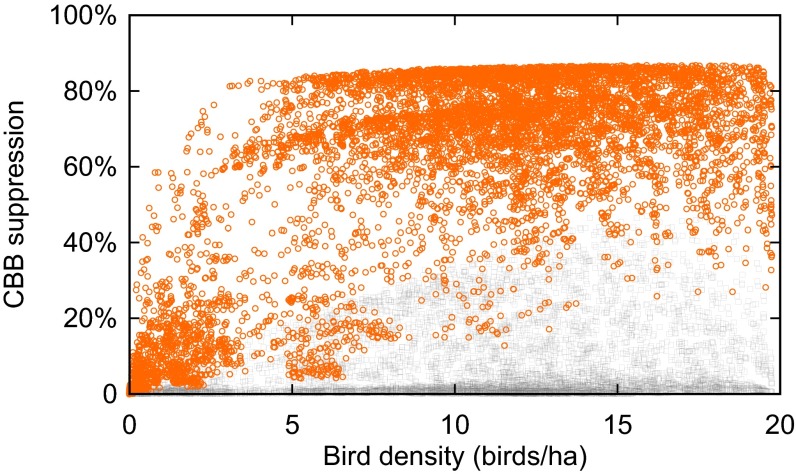
Fig. 5.
CBB suppression (percentage by which birds reduce infestation rate over the entire growing season) vs. bird density. Symbols represent each of 512 parameter combinations of all scenarios in all experiments except the trees patch size experiment. The orange circles represent CBB in sun coffee, and the gray squares represent CBB in shade coffee. The calibration analysis indicated that the model somewhat overpredicts CBB suppression in sun coffee and underpredicts it in shade coffee (SI Methods).

