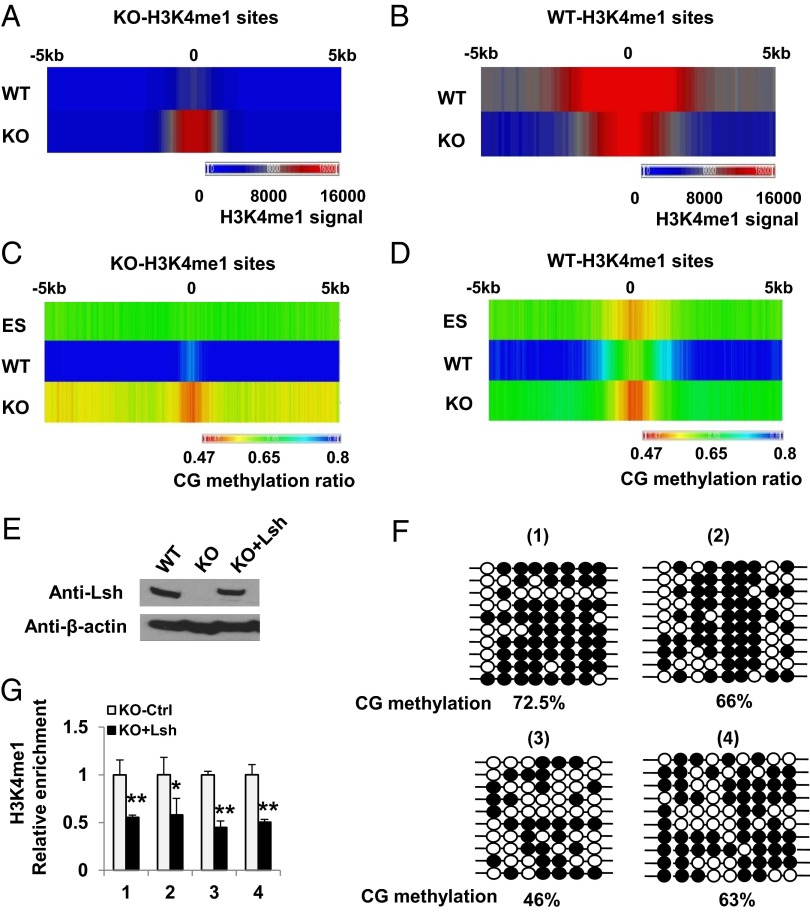
Fig. 2.
Dynamic link between CG hypomethylation and H3K4m1 perturbation. (A–D) Colorimetric representation of H3K4me1 (A and B) and CG methylation (C and D) at KO-H3K4me1 (A and C) and WT-H3K4me1 (B and D) sites comparing WT MEFs (WT), KO MEFs (KO), and WT ES cells (ES). (E) Lsh Western blot analysis after Lsh reexpression (KO+Lsh) in KO MEFs. (F) Bisulfite sequencing representing the CG methylation ratio at four KO-H3K4me1 peaks in Lsh KO that reexpress Lsh (KO+Lsh). The same four sites as in SI Appendix, Fig. S1 are shown for comparison. (G) Relative enrichment of H3K4me1 after Lsh reexpression (KO+Lsh) at four KO-H3K4me1 sites compared to control treated KO MEFs (KO-Ctrl). **P < 0.01; *P < 0.05.

