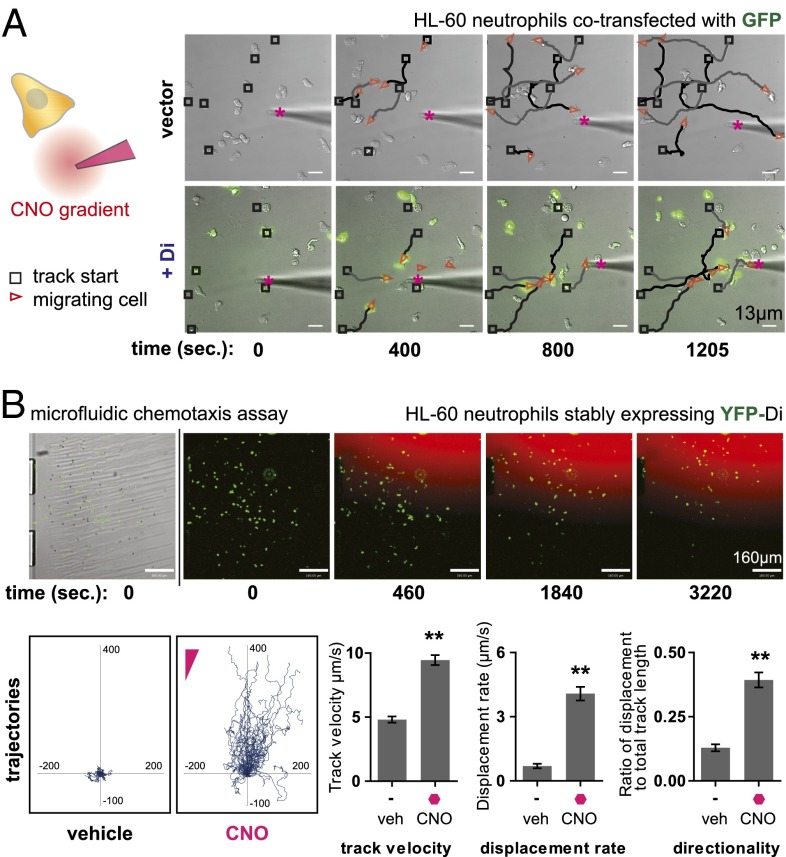
Fig. 2.
Microscopic analysis of HL-60 neutrophil polarization and cell migration in response to CNO. (A) HL-60 neutrophils coelectroporated with Di and GFP were plated on a fibronectin-coated glass surface and observed by time-lapse microscopy in the presence of a steep, micropipette-generated gradient of CNO. Di- and GFP-expressing cells migrated directionally toward the micropipet. Fluorescent dye Alexa 594 tracer is mixed with CNO solution in micropipet to visualize the diffusive gradient. The micropipet gradient source is marked by a magenta asterisk. Track start locations are marked by black squares, and red triangles mark cell location and direction in each frame. Traces (black and gray) connect track start locations (black squares) and cell location (red triangles). Drug concentration used (at source): 1μM CNO. See Movies S2–S4 for full movies. (B) HL-60 neutrophils stably expressing Di were placed in the fibronectin-coated viewing area of a microfluidic chemotaxis assay device capable of generating a smooth, stable gradient of CNO. Time-lapse microscopy was used to track cell migration, and cell-tracking software was used to quantitate various migration metrics. Cells migrated toward the CNO gradient (trajectories plotted with cell start locations at origin) and show increased track velocity, displacement rate, and directionality compared with basal motility in the presence of vehicle control. Drug concentration used (at source): 200 nM CNO. Mean ± SEM is shown for n = 61 cells tracked (**P < 0.0001 by Student t test). See Movie S5 for full movie.

