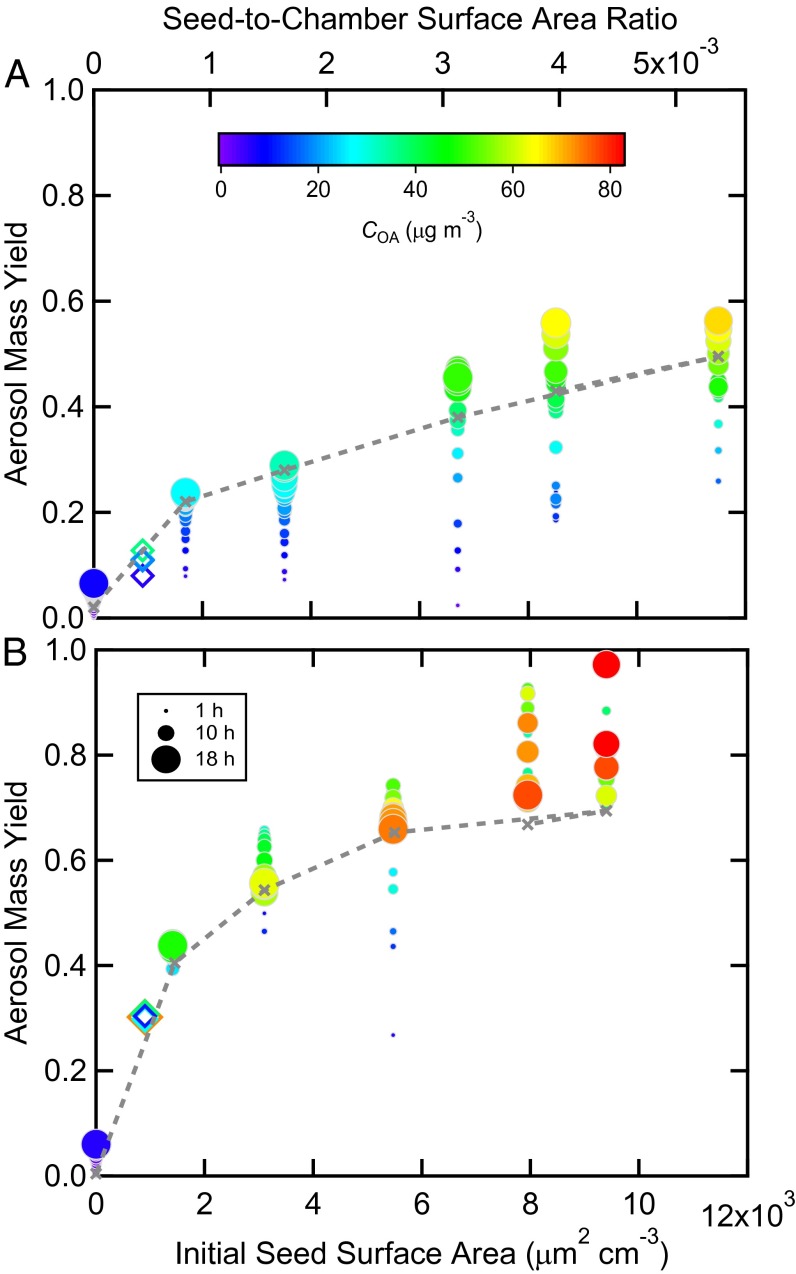
Fig. 1.
Hourly averaged lower bound SOA yields over the course of a toluene photooxidation experiment as a function of initial ammonium sulfate seed surface area for (A) high-NOx and (B) low-NOx conditions. Symbol color indicates the SOA mass concentration and symbol size the time after lights were turned on. The filled circles are from the current experiments and the open diamonds from ref. 21. The dashed gray line and × are the end-of-experiment yields from the optimized best-fit SOM simulations.

