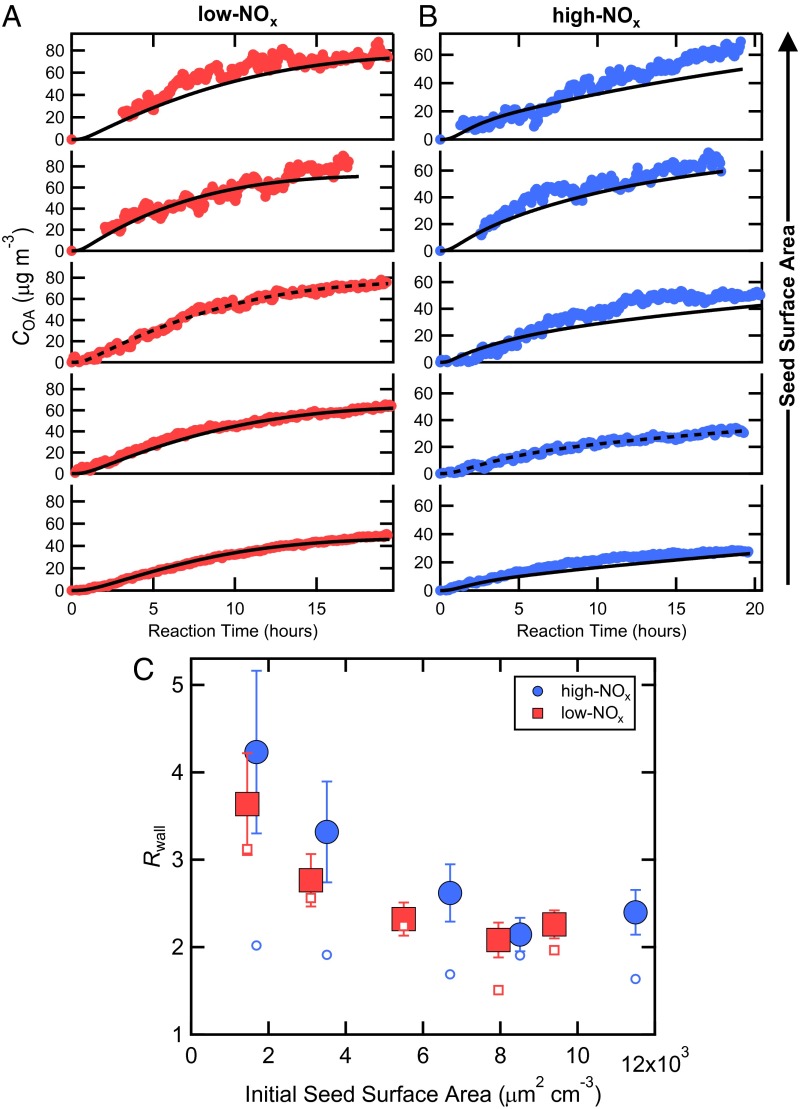
Fig. 2.
Observed (points) and simulated (lines) SOA concentrations for each photochemical oxidation experiment performed for different initial inorganic seed surface area for (A) low-NOx and (B) high-NOx conditions. The dashed lines indicate the experiment to which the SOM was explicitly fit, and the solid lines indicate simulation results based on those fits. (C) The wall loss bias factor, Rwall, as a function of seed surface area. Filled symbols use the optimal kw/α pair and the corresponding best-fit SOM parameters determined from A and B. Open symbols assume α = 1 and each experiment was individually fit using the optimal kw. The error bars indicate the 1σ SD in Rwall for each experiment over the period when COA > 0.5 μg m−3.

