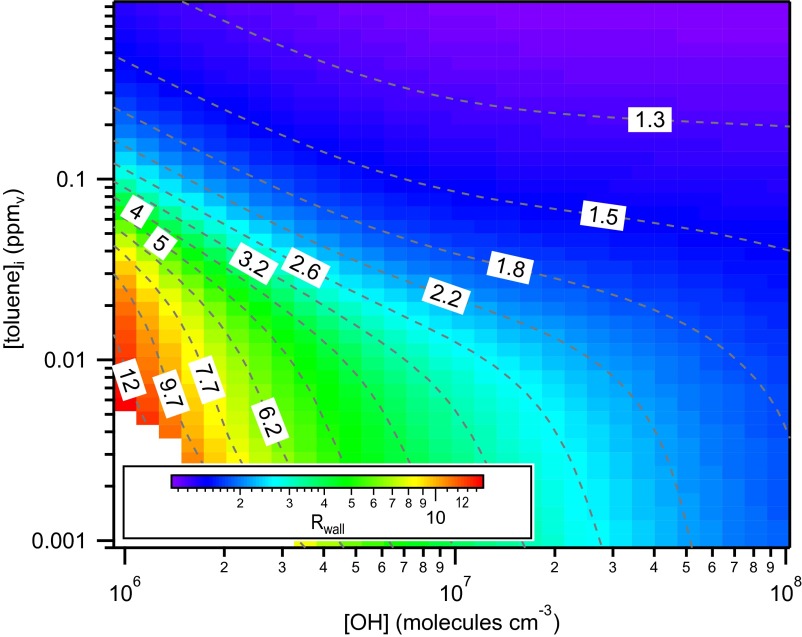
Fig. 3.
Calculated SOA yield bias as a function of initial toluene concentration and OH concentration when kw = 2.5 × 10⁻⁴ s−1 and Cw = 10 mg m−3. The Rwall values for a given [toluene] and [OH] are indicated by colors and contours, and are averaged over the period when CSOA > 0.5 μg m−3 to the end of an experiment at 18 h. Results are based on the optimal fit of the SOM to the low-NOx experiments.

