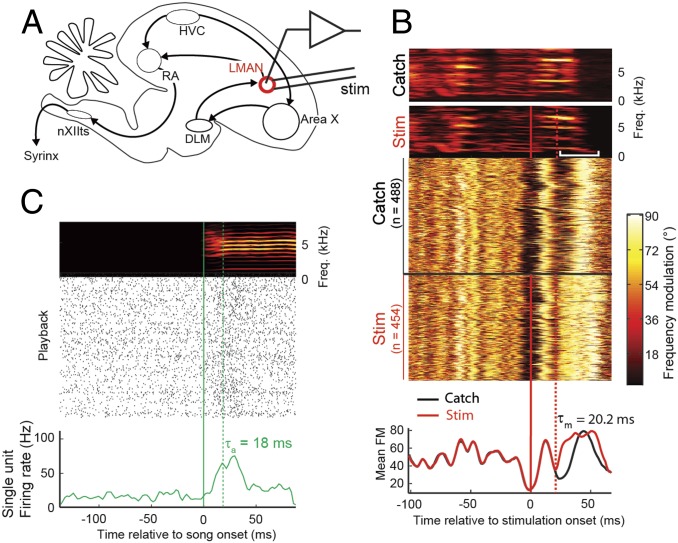
Fig. 2.
LMAN sensorimotor loop delay. (A) Sagittal schematic of the songbird brain. Both HVC and the LMAN project to the premotor RA. DLM, dorsal lateral nucleus of the medial thalamus; nXIIts, hypoglossal nucleus. (B) Electrical stimulation in LMAN using paired 0.2-ms current pulses of 500 µA (separated by 1 ms) during song leads to transient distortions of song syllables (brief pitch decrease, red square bracket) compared with catch trials. (Top) Log-power sound spectrograms (high and low power shown in yellow and black, respectively) of a nonstimulated (catch) syllable and a stimulated (stim) syllable. A stack plot of frequency modulation (FM; Middle) and the mean FM (Bottom) across 488 nonstimulated syllables (catch trials) and 454 stimulated syllables (Stim) reveals a transient FM increase corresponding to a brief pitch decrease (white square bracket in the sound spectrogram) roughly 20 ms (dashed red line) after stimulation onset (time origin, thick red line). (C) Log-power sound spectrogram (Top), raster plot (Middle), and mean firing rate (Bottom) of a LMAN single unit with short auditory latency of 18 ms to playback onset of the bird’s own song (n = 307 playbacks).

