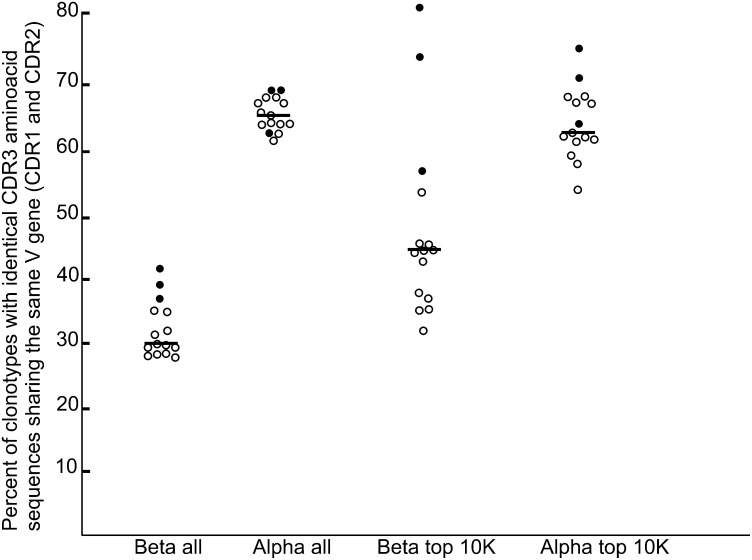
Fig. 5.
The percentage of clonotypes with identical CDR3 amino acid sequences sharing the same V gene for all possible pairs of individuals. Black circles indicate twin pairs, empty circles indicate all other pairs, and lines indicate median values. β all, among all identified TCRβ clonotypes; α all, among all identified TCRα clonotypes, β top 10K, among 10,000 most abundant TCRβ clonotypes; α top 10K, among 10,000 most abundant TCRα clonotypes.

