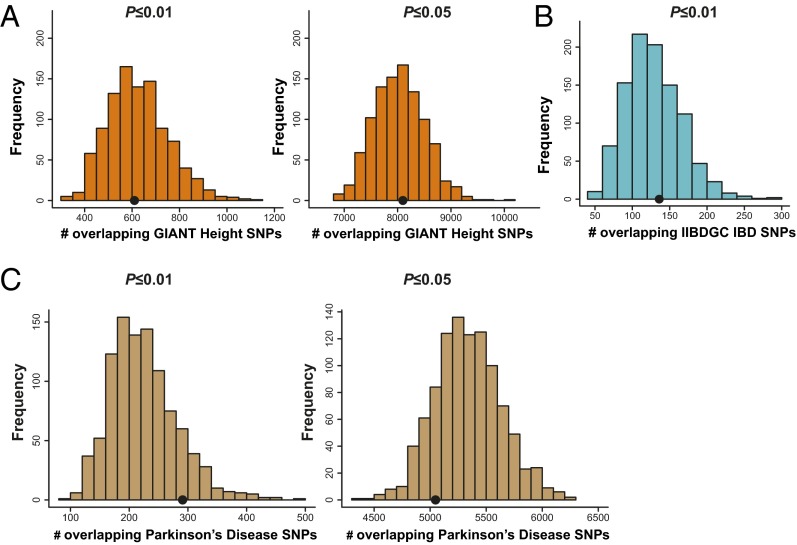
Fig. 4.
SNPs associated with the euphoric response to d-amphetamine (P ≤ 0.01 and P ≤ 0.05) do not show enrichment among SNPs associated with height, inflammatory bowel disease, or Parkinson disease. We performed these analyses as a negative control. A shows the results for the height enrichment analysis. Results from the P ≤ 0.01 threshold are shown in Left, and results from the P ≤ 0.05 threshold are shown in Right. The black dots represent the observed count of height-associated SNPs among associations with d-amphetamine response. The histograms represent the null distribution of overlapping SNPs generated from 1,000 random permutations of the amphetamine data. B shows the results for the inflammatory bowel disease enrichment analysis [P ≤ 0.01 threshold; P ≤ 0.05 results were not available from International Inflammatory Bowel Disease Genetics Consortium (IIBDGC)]. The black dot represents the observed count of inflammatory bowel disease-associated SNPs among associations with d-amphetamine response. The histogram represents the null distribution of overlapping SNPs generated from 1,000 random permutations of the amphetamine data. None of these results were significant. C shows the results for the Parkinson disease enrichment analysis. Results from the P ≤ 0.01 threshold are shown in Left, and results from the P ≤ 0.05 threshold are shown in Right. The black dots represent the observed count of Parkinson disease-associated SNPs among associations with d-amphetamine response. The histograms represent the null distribution of overlapping SNPs generated from 1,000 random permutations of the amphetamine data. GIANT, Genetic Investigation of Anthropometric Traits.

